Quick Start Tutorial
This chapter provides an overview of the various pages and functions of Cinnamon. It serves as a quick start guide, offering a brief introduction to the essential steps needed to protect your data.
IMPORTANT: This guide primarily focuses on how to interact with the application. It does not delve deeply into the impact of different steps and configurations on the outcomes. For detailed information on these aspects, please refer to the dedicated guide.
Opening Cinnamon
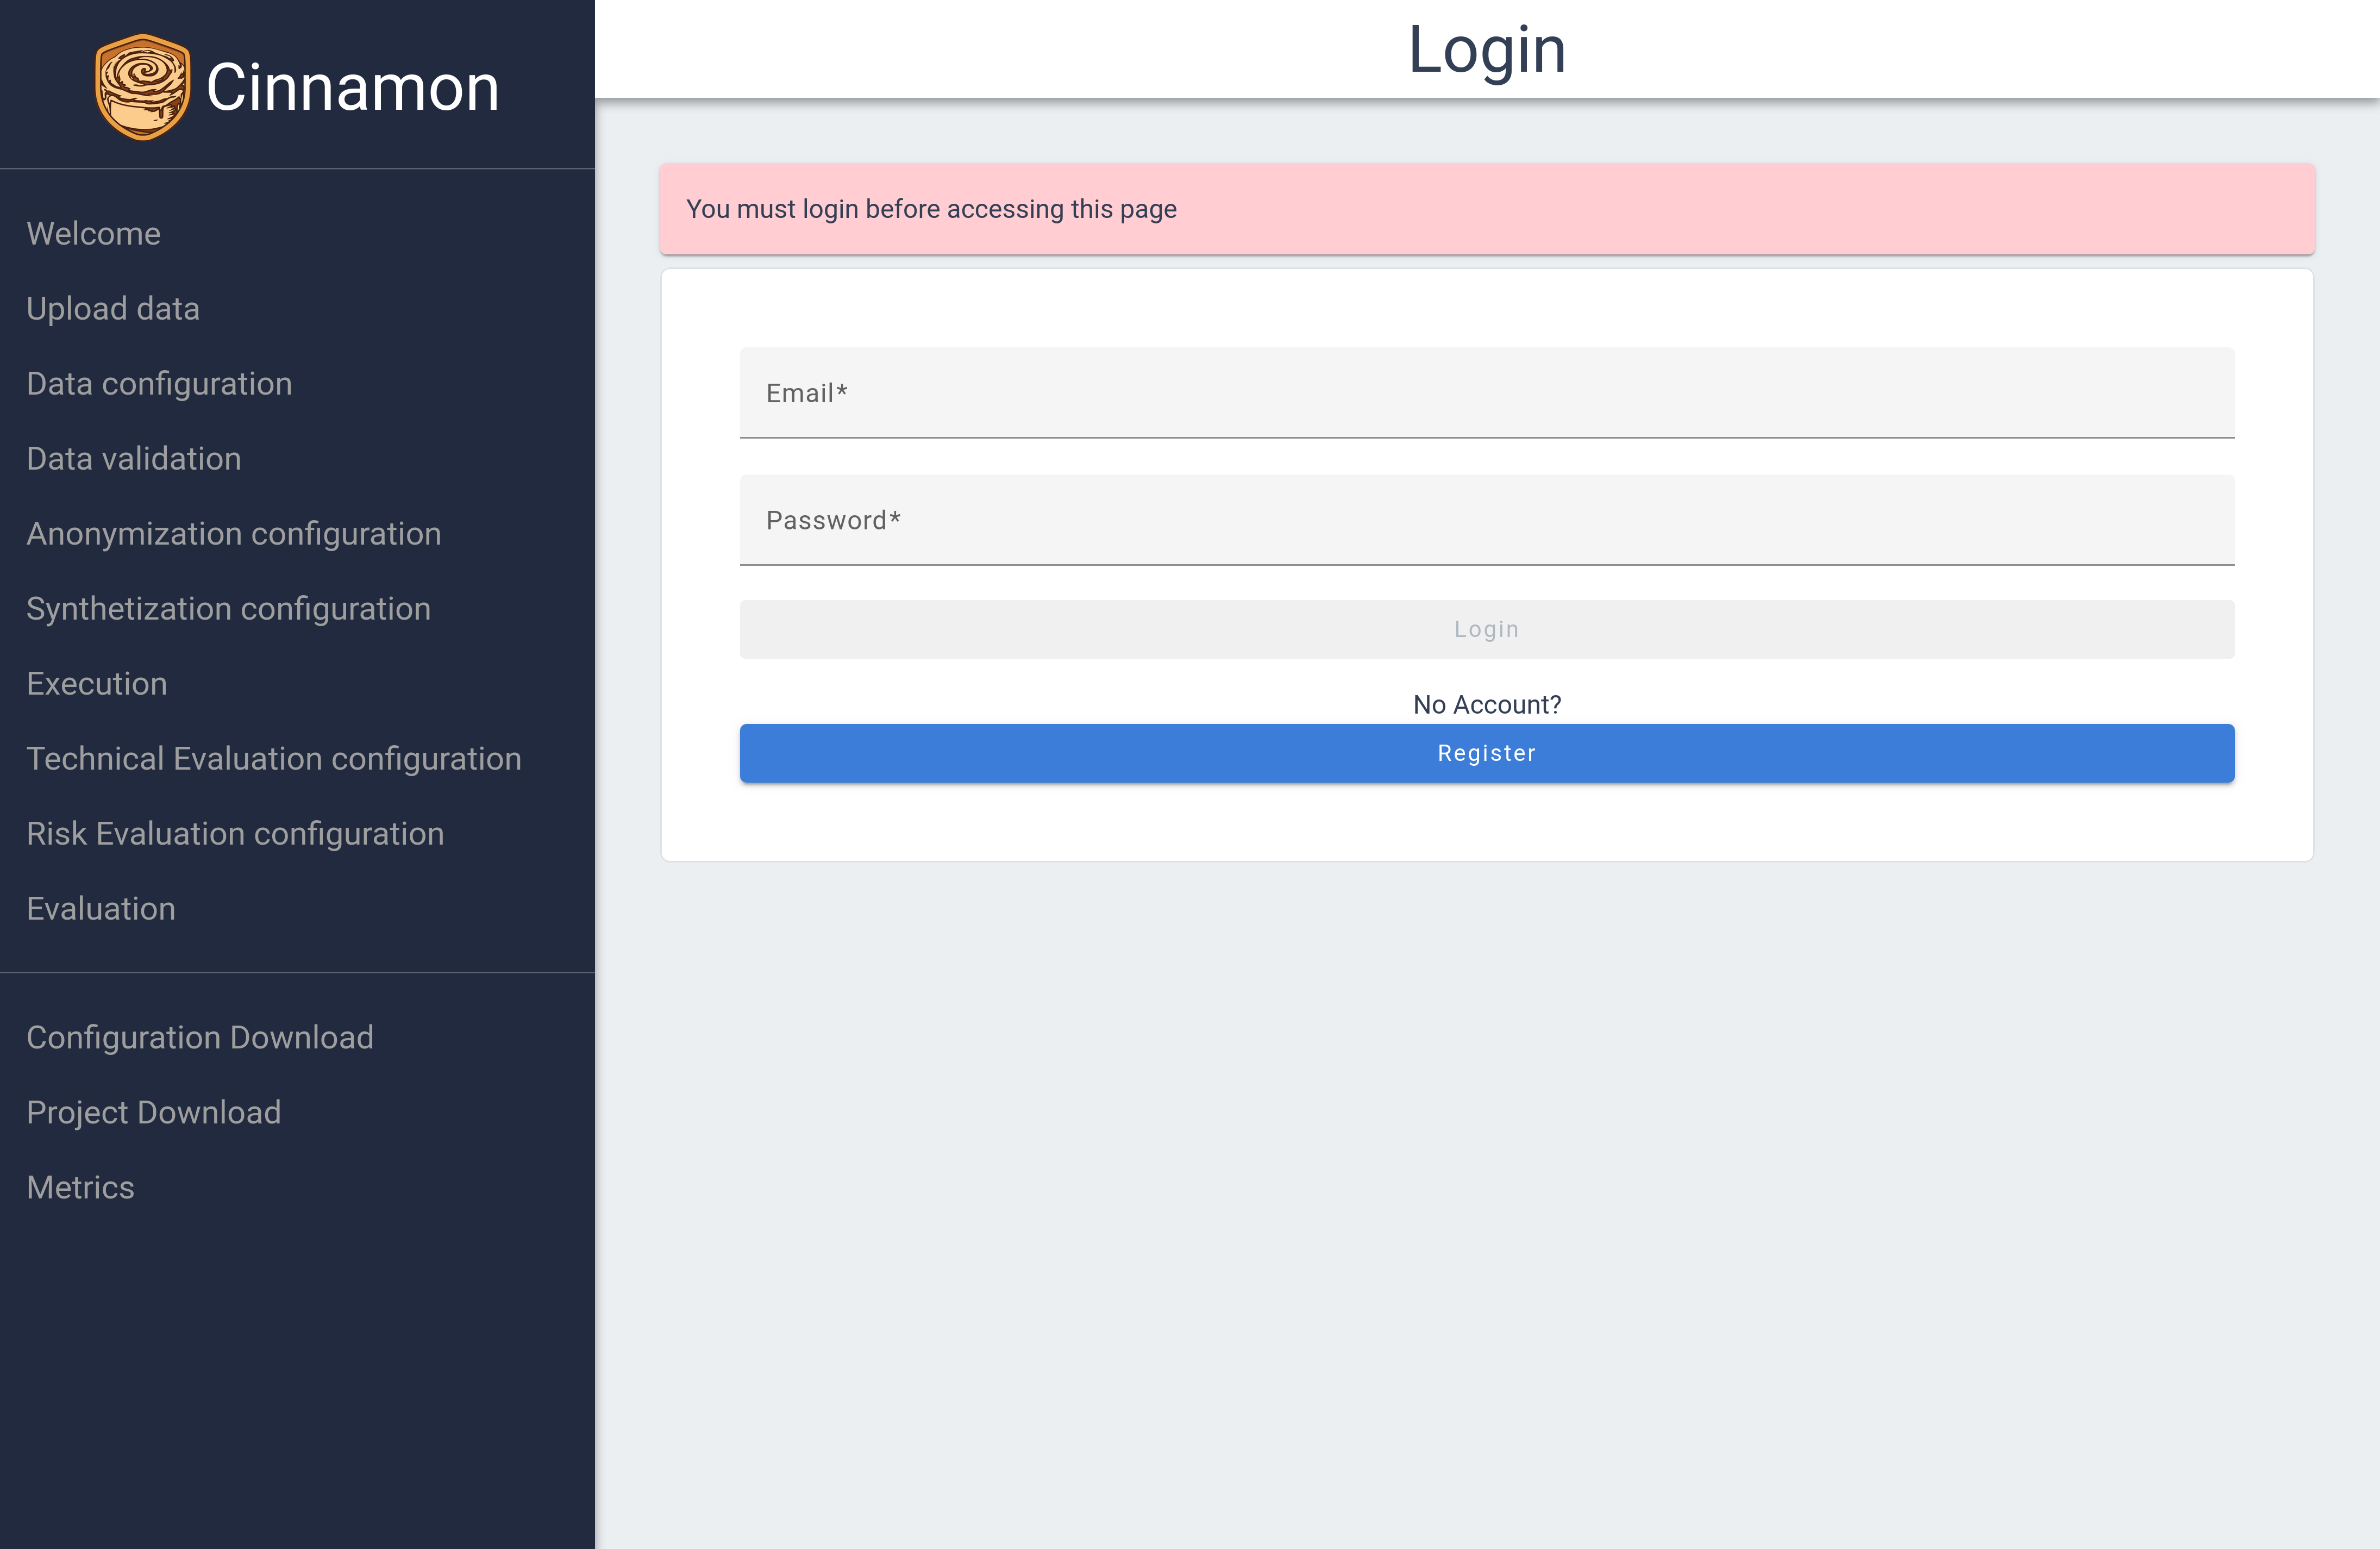
Once you have installed Cinnamon, either locally or on a web server, you can access the application via its URL (for a local installation, use localhost:8080). Opening this URL will take you to the application’s login page.
UI and Navigation
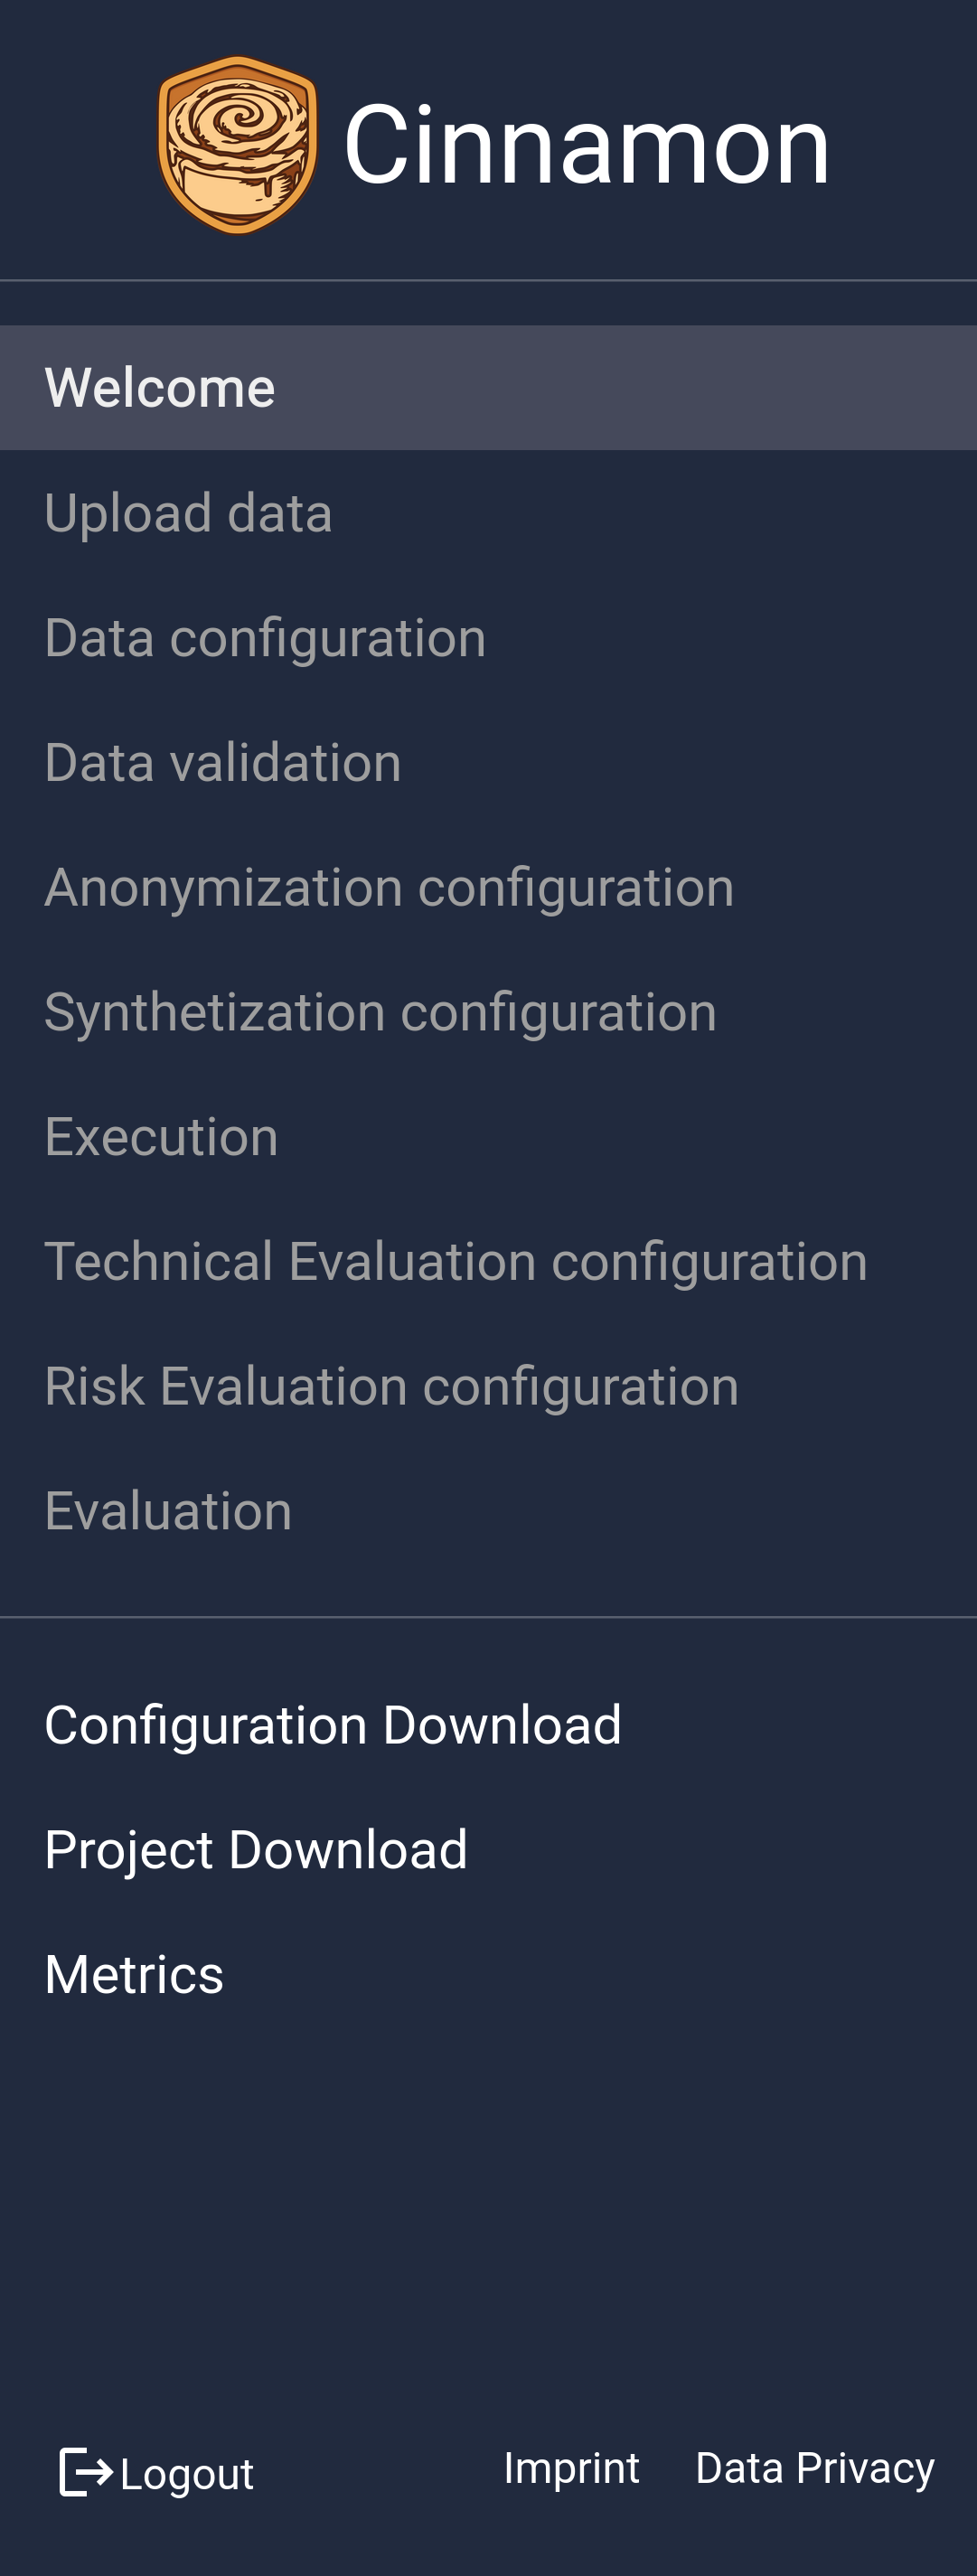
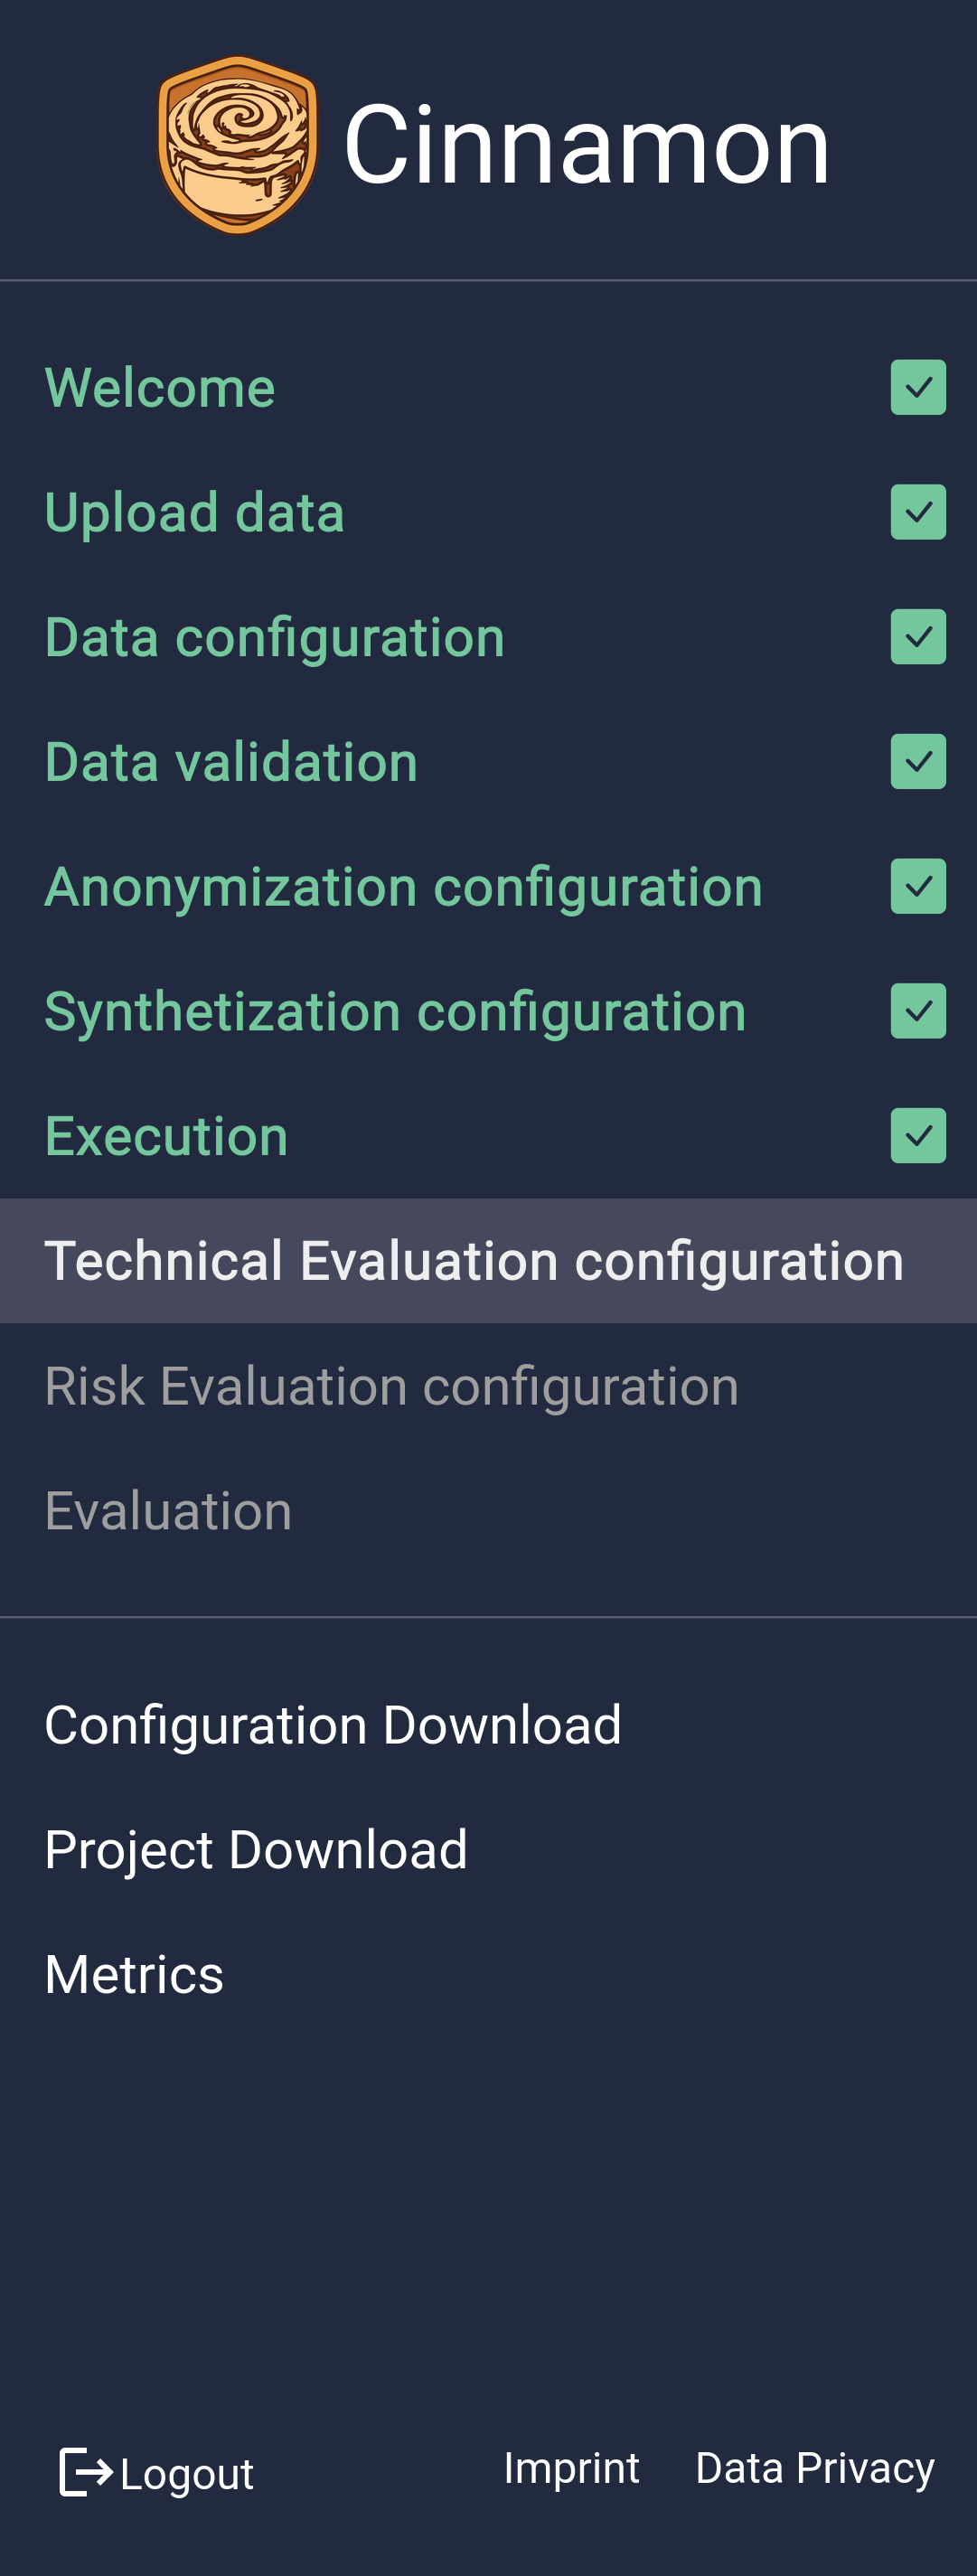
The UI of cinnamon is split into three pieces:
- ■ Navigation: The navigation of the app, indicating which steps have been completed and what the current step is. Clicking on it allows to change the current page.
- ■ Page Title: The title of the page, indicating the current content viewed.
- ■ Content: The actual content of the application. All interactions take place here.
The navigation panel remains visible throughout your use of the app, providing a clear overview of all steps involved in the process. It shows your current progress, highlights which steps are completed, and allows you to easily navigate back to previous steps to make any necessary adjustments. This feature ensures you can manage and refine your configuration efficiently as you work through the process.
Account / Project Management
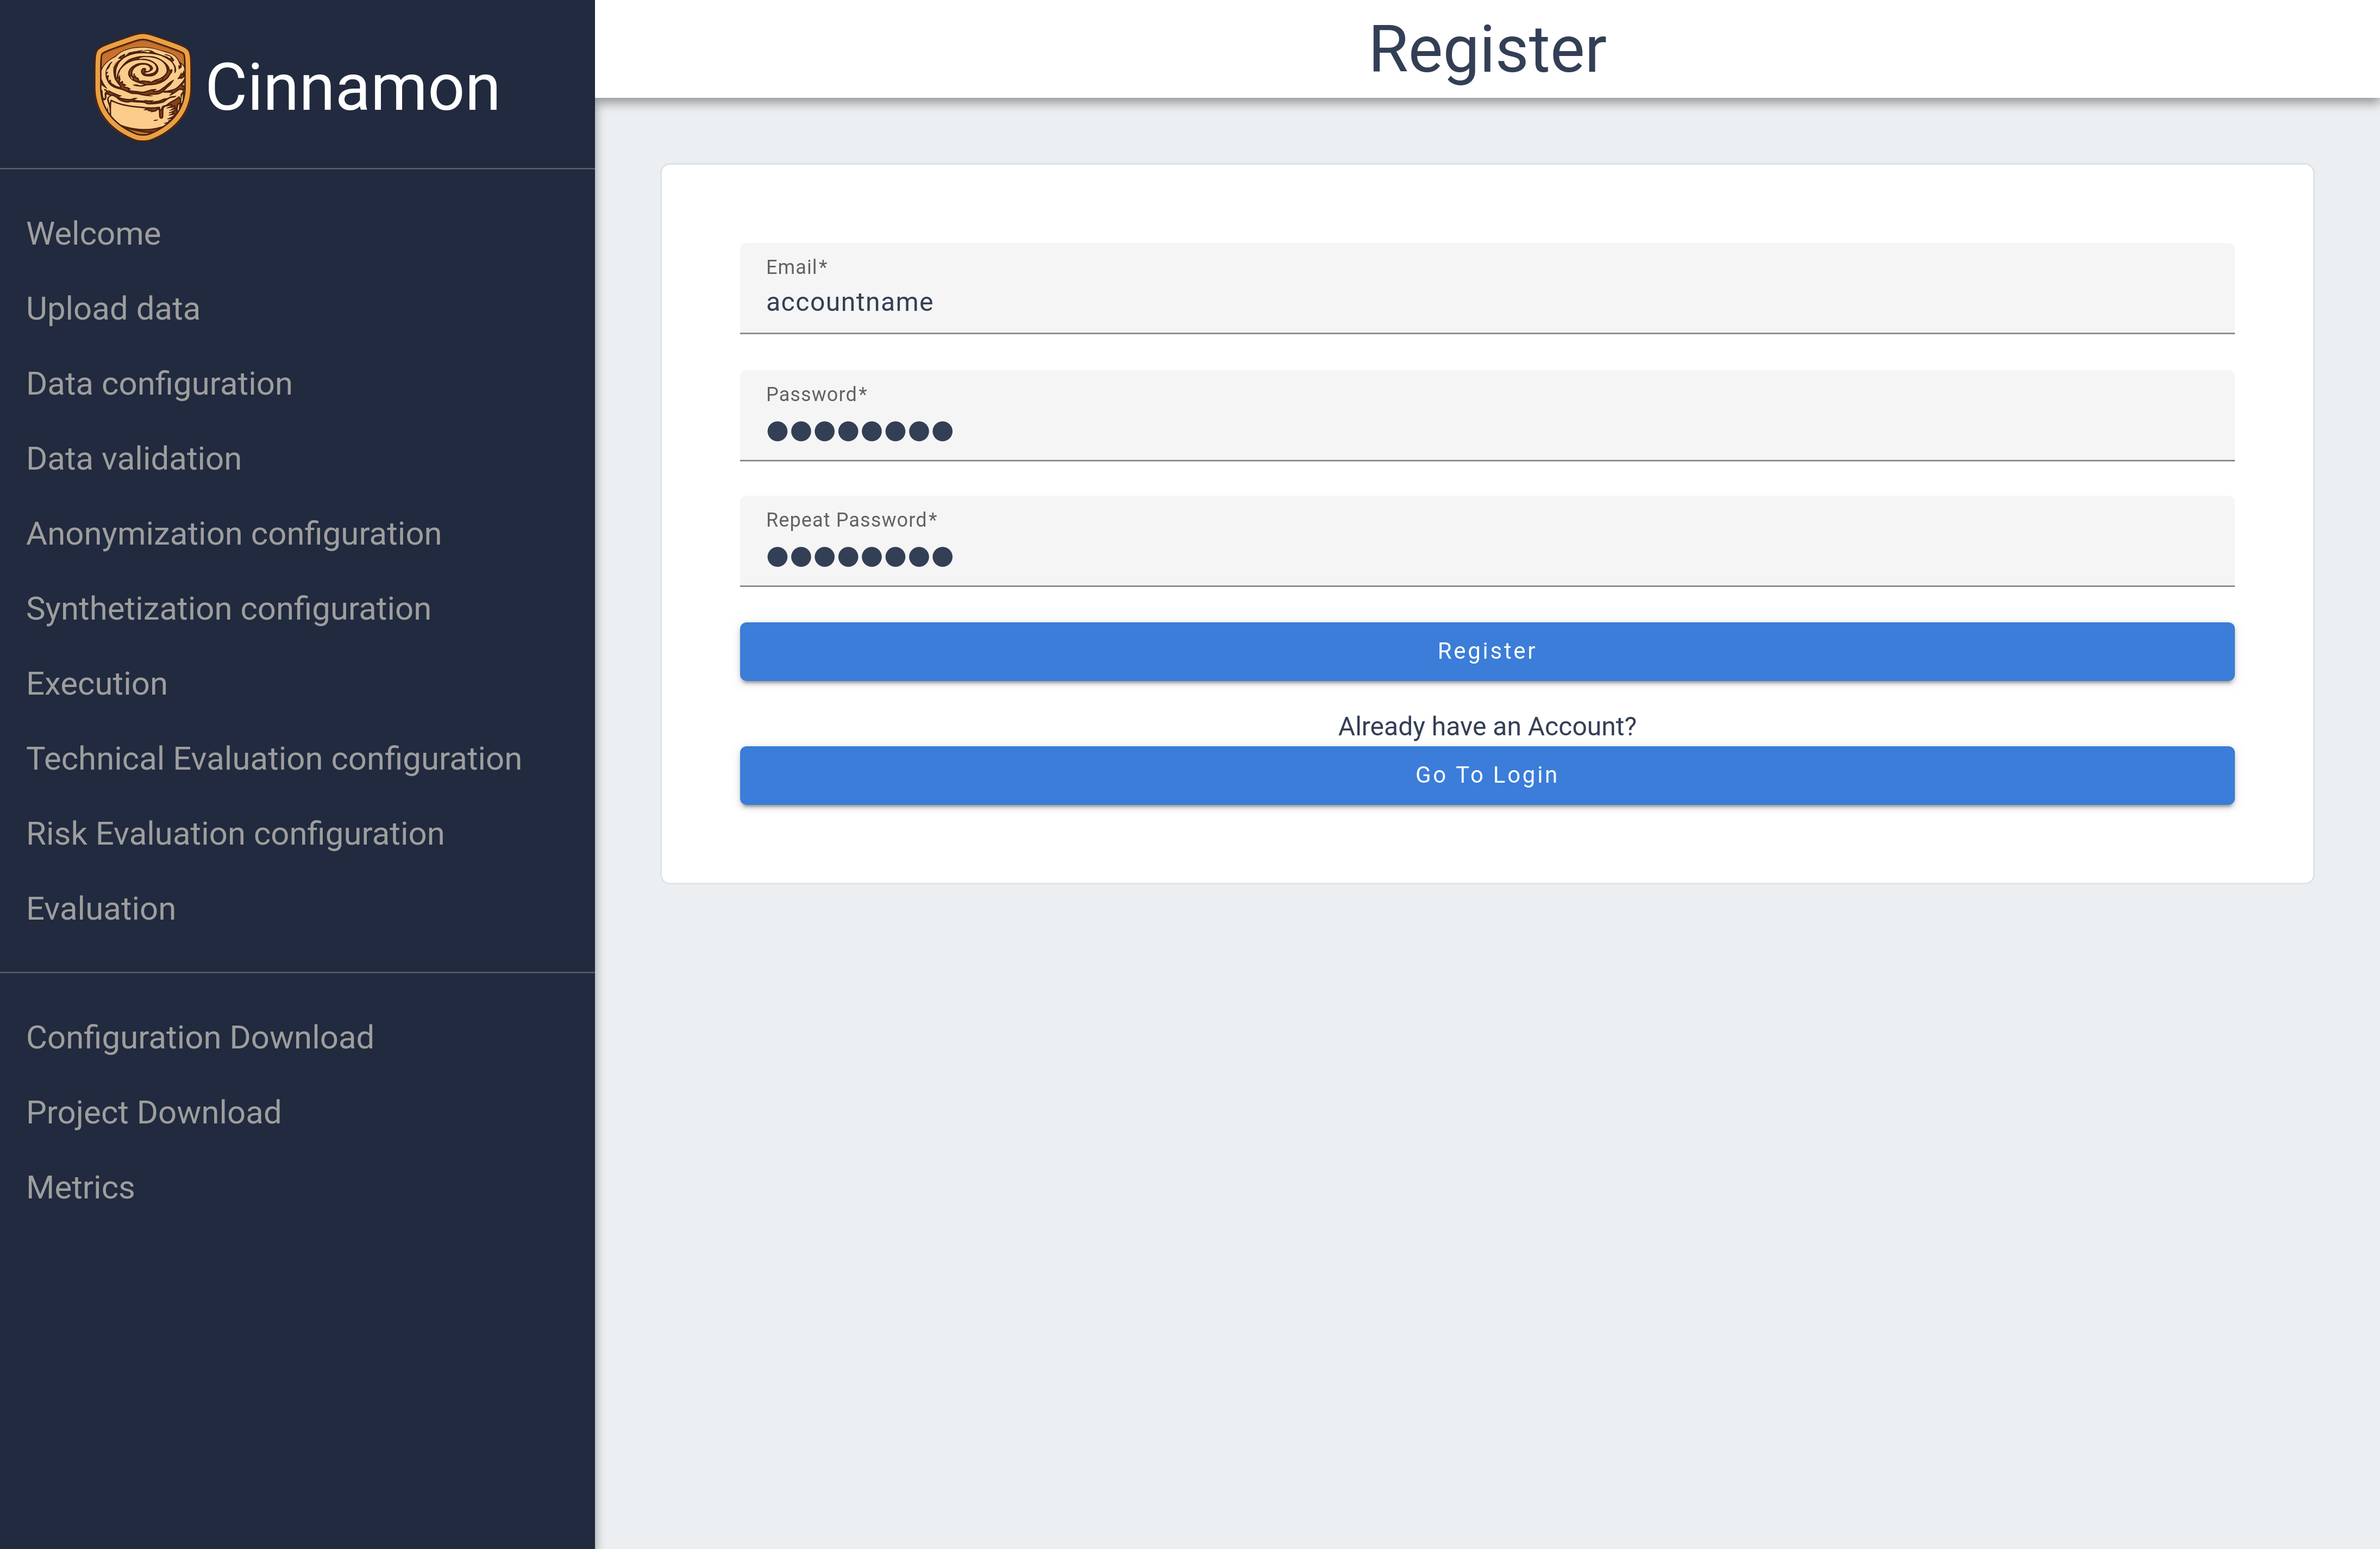
In Cinnamon, projects are linked directly to individual accounts, and currently, there is no option for collaborative work. To create new projects, you must set up a new account. This system ensures that only authorized users can access uploaded data and download both anonymized data and configurations. However, you can delete uploaded data without deleting your account, allowing you to start afresh if needed.
To create an account, click the register button on the login page. You can register with just a username and password. There are plans to add email support, LDAP sync, and other security options in the future. Once your account is created, you can log in immediately.
Start
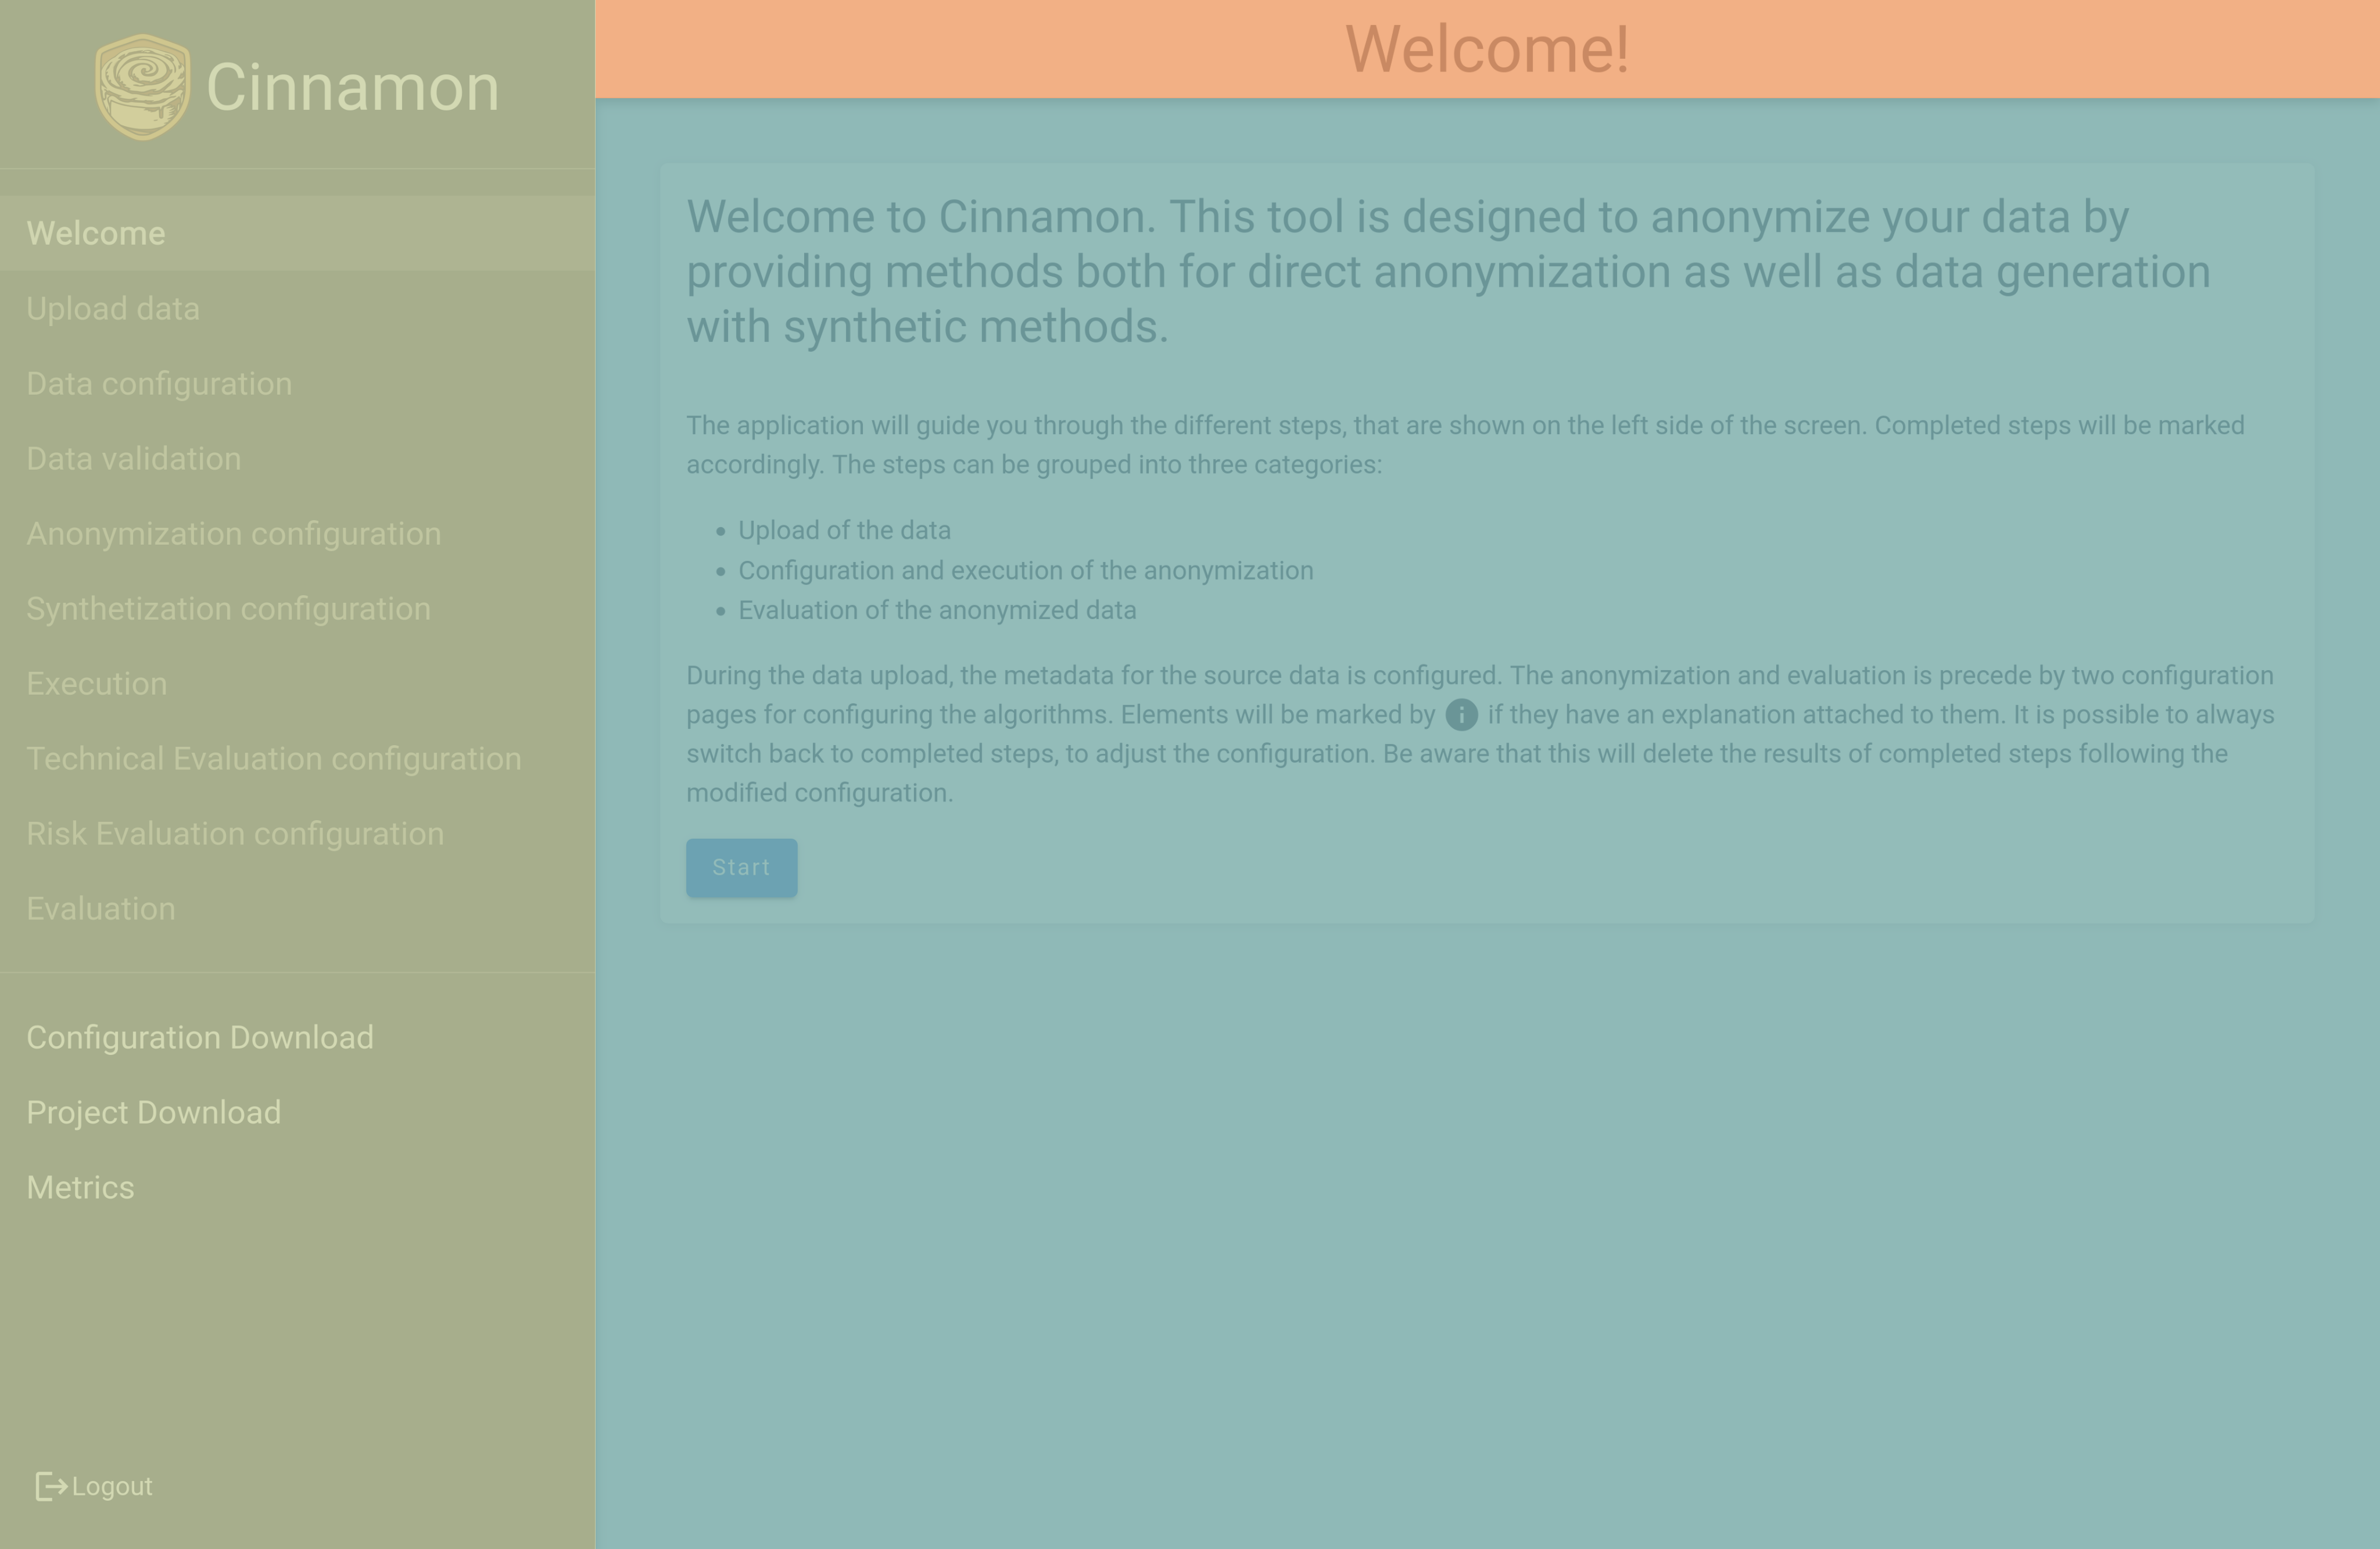
After login you will see the start page of application, indicating that everything worked correctly.

Later in development you will be able to choose different modes here. For now, only the standard mode is implemented. Read the information on this page carefully and continue with the  button
Uploading Data
 To upload your data, start by clicking the first
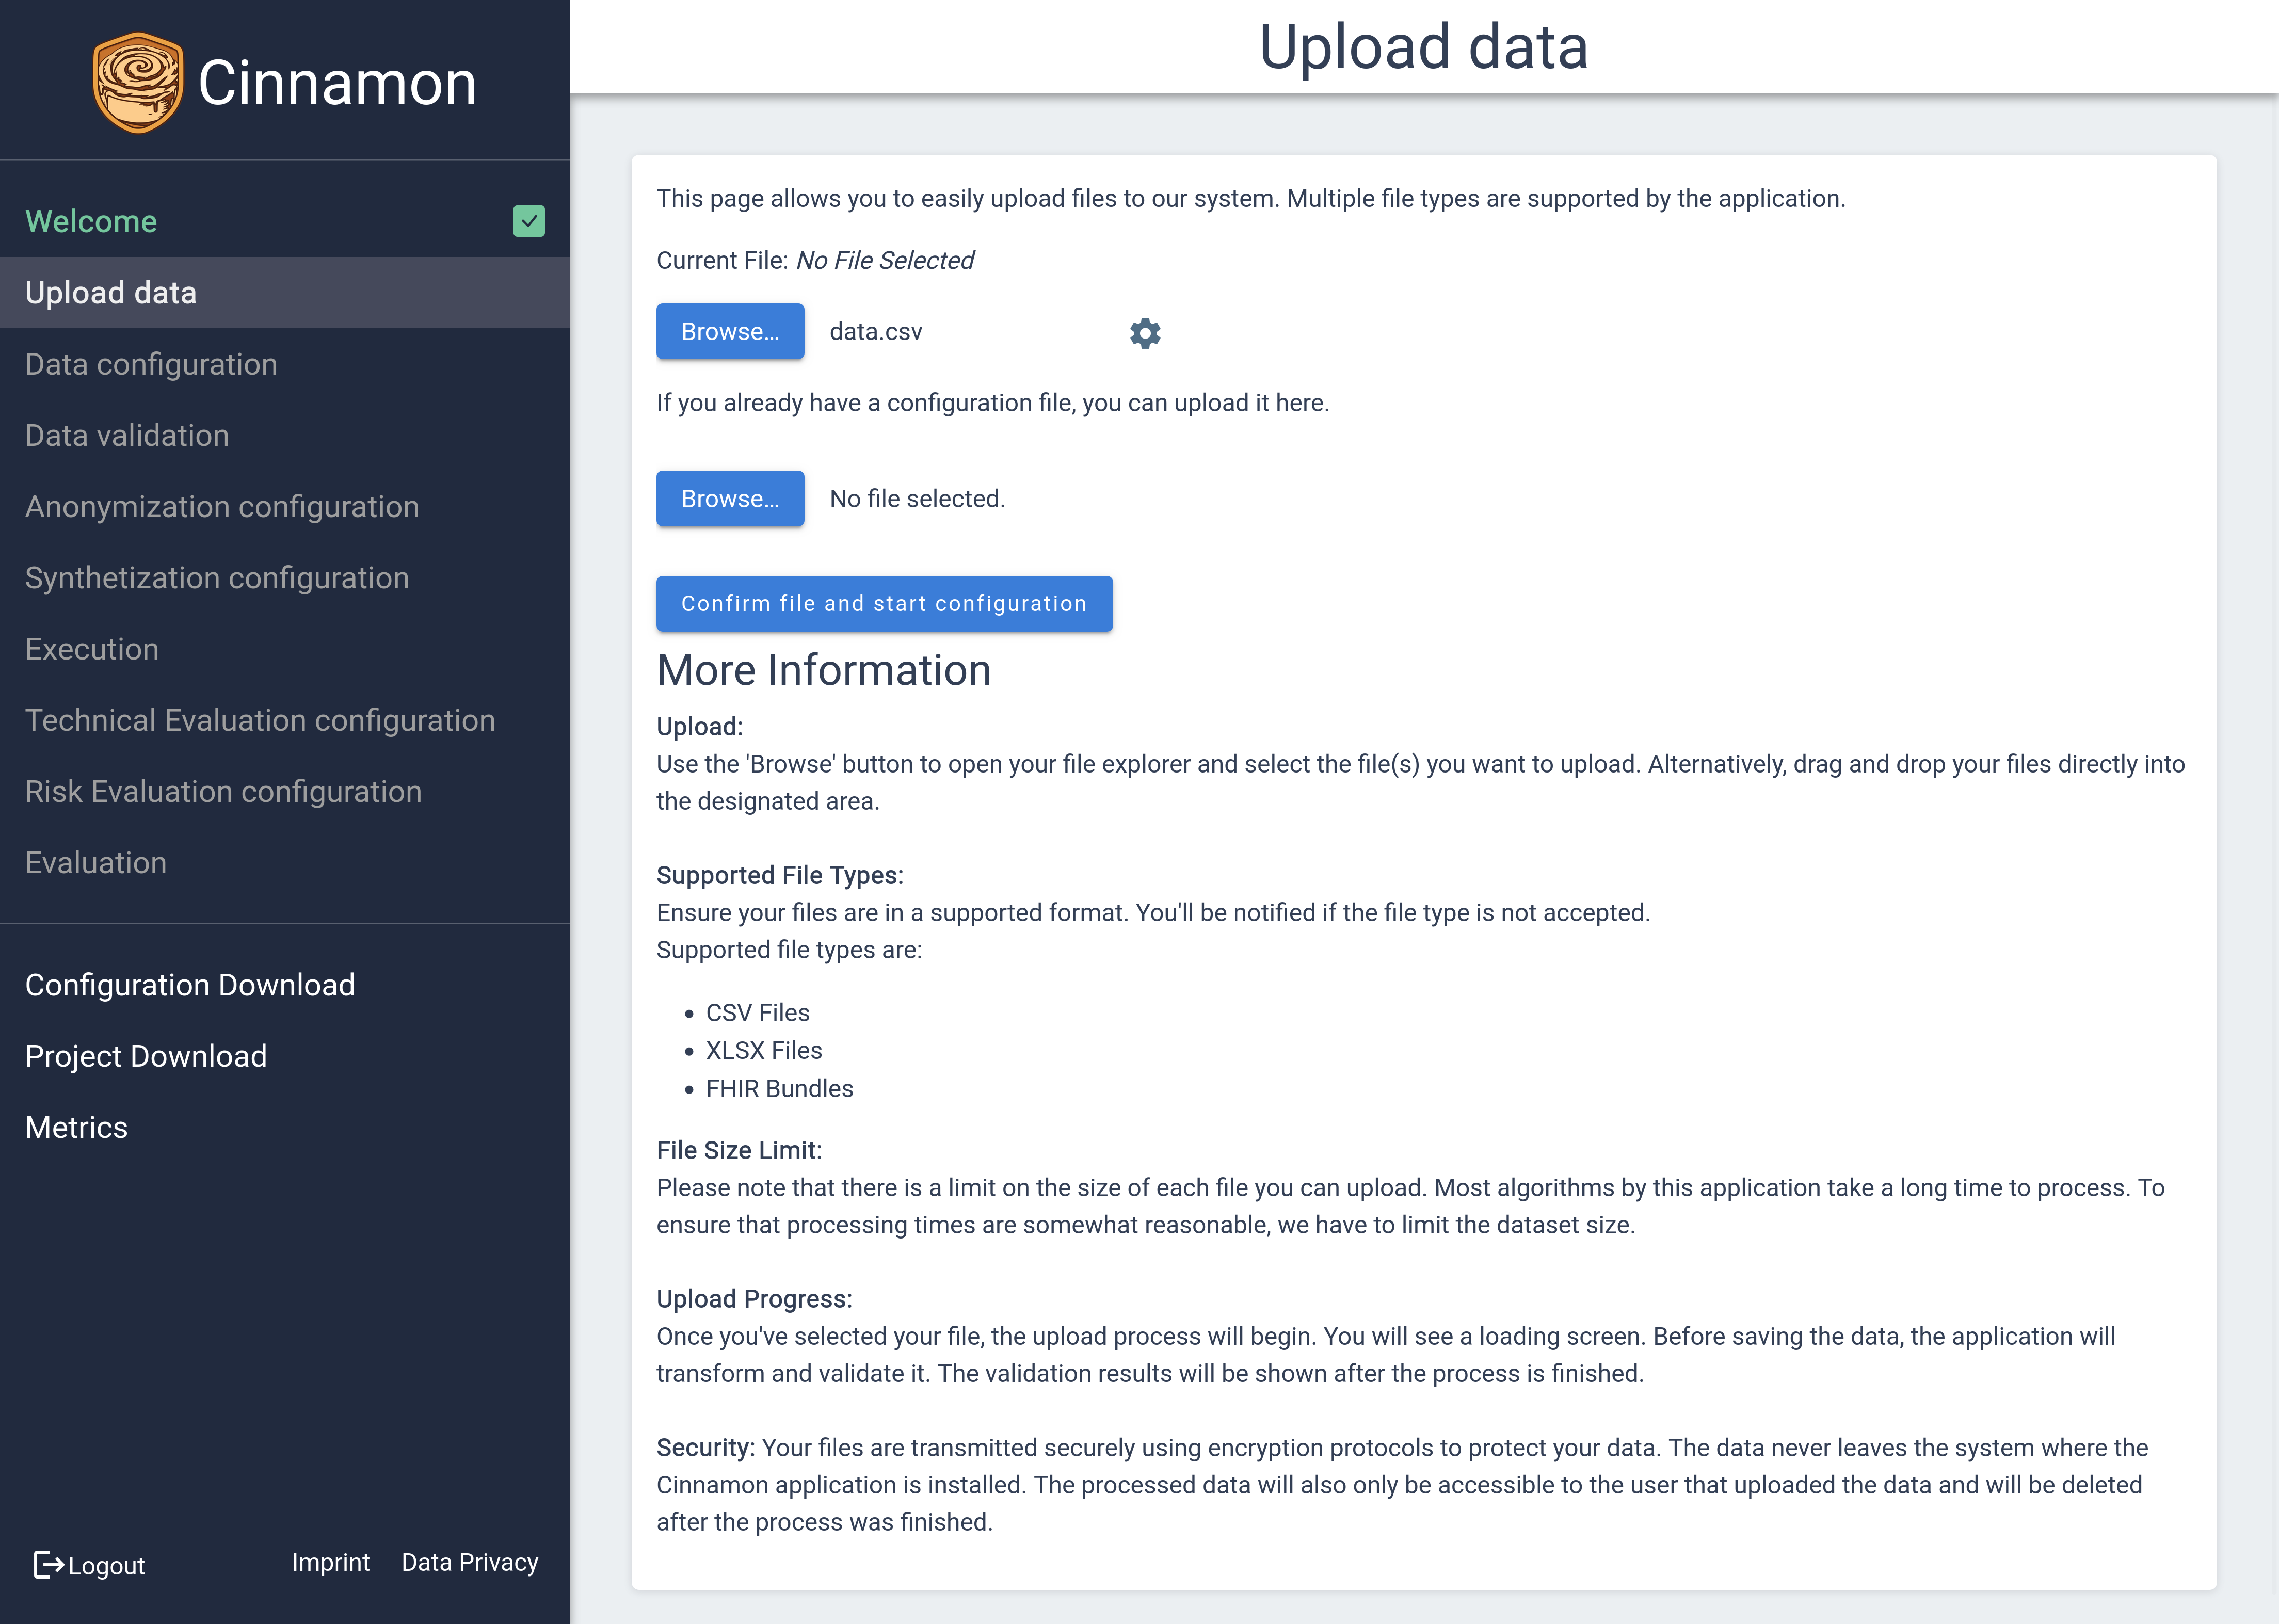
  button, which will open a dialog for you to select the file you wish to upload. Supported file types include .csv and .xlsx, ensuring compatibility with common data formats. Once you’ve selected your file, you can click on the
 ![]() icon to access additional file information and configure specific settings, such as CSV or XLSX options, to tailor the import process to your needs. Furthermore, if you have previously defined configurations, you can effortlessly apply them to your new upload using the second button, making the process quick and efficient.
icon to access additional file information and configure specific settings, such as CSV or XLSX options, to tailor the import process to your needs. Furthermore, if you have previously defined configurations, you can effortlessly apply them to your new upload using the second button, making the process quick and efficient.
Confirm your upload by clicking the  button.
Configuring Data
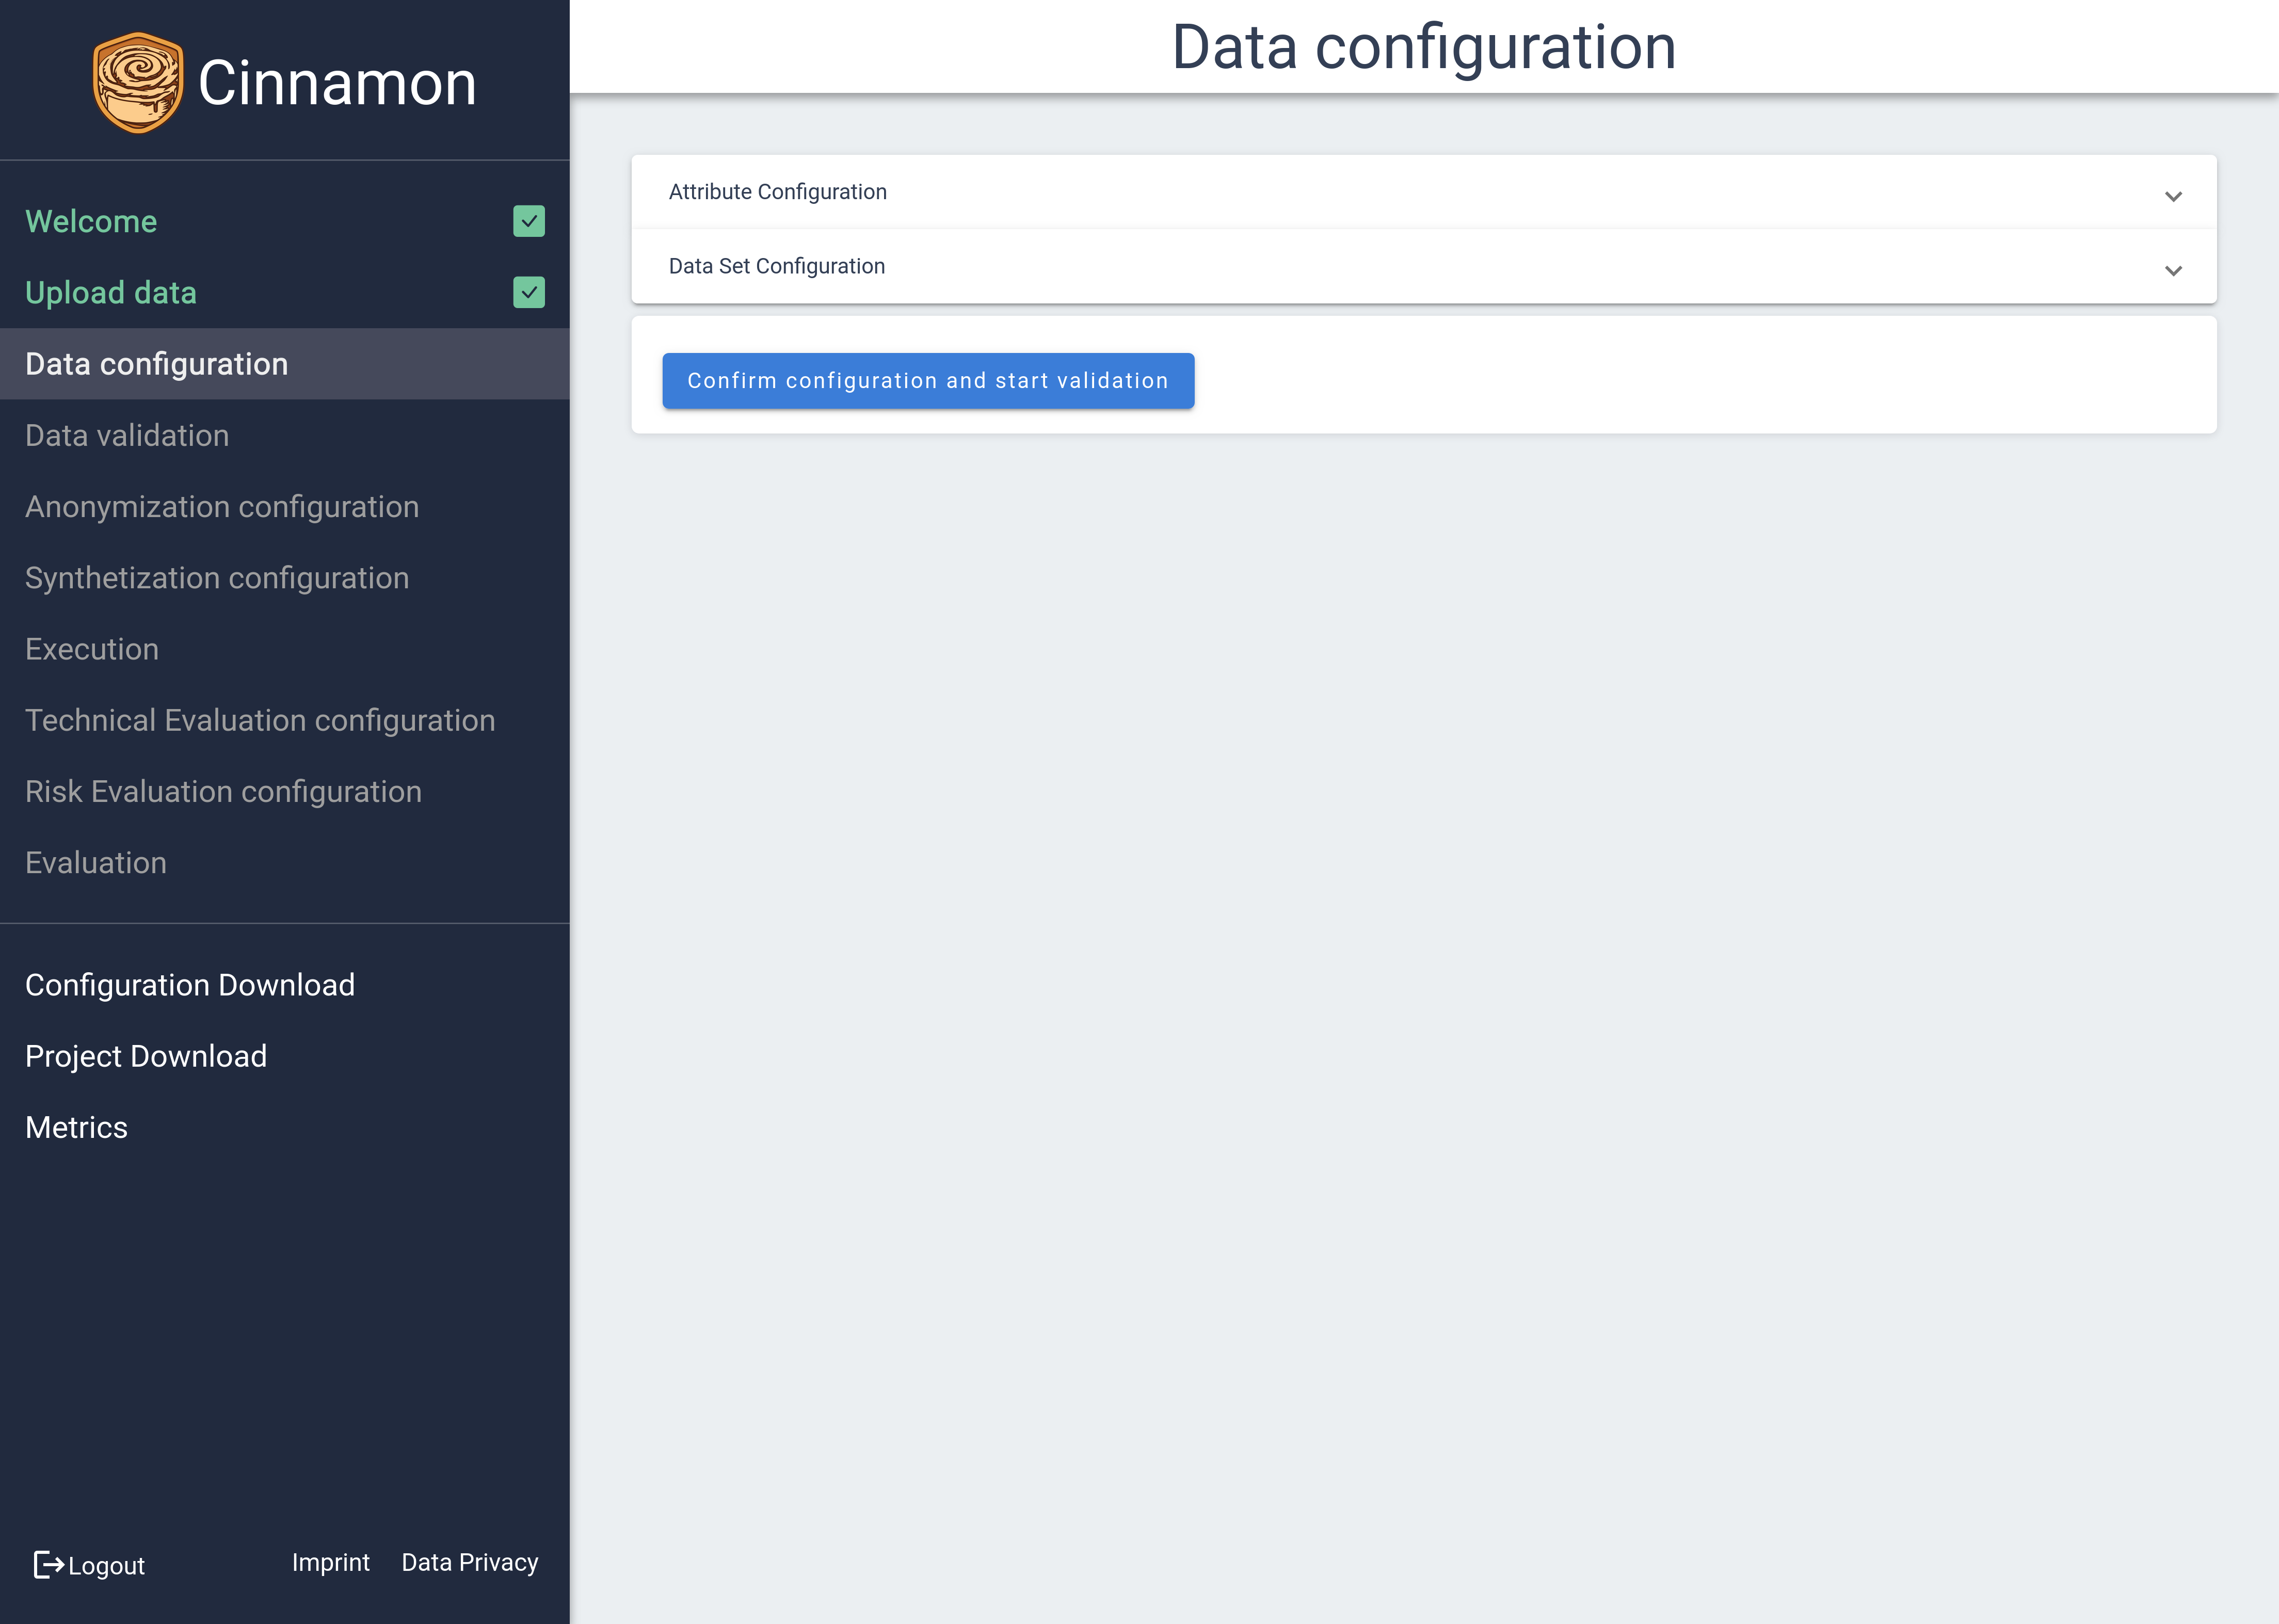
Upon entering the Data Configuration section, you’ll see two main areas: Attribute Configuration and Dataset Configuration. These sections can be expanded by clicking on them to reveal more details.
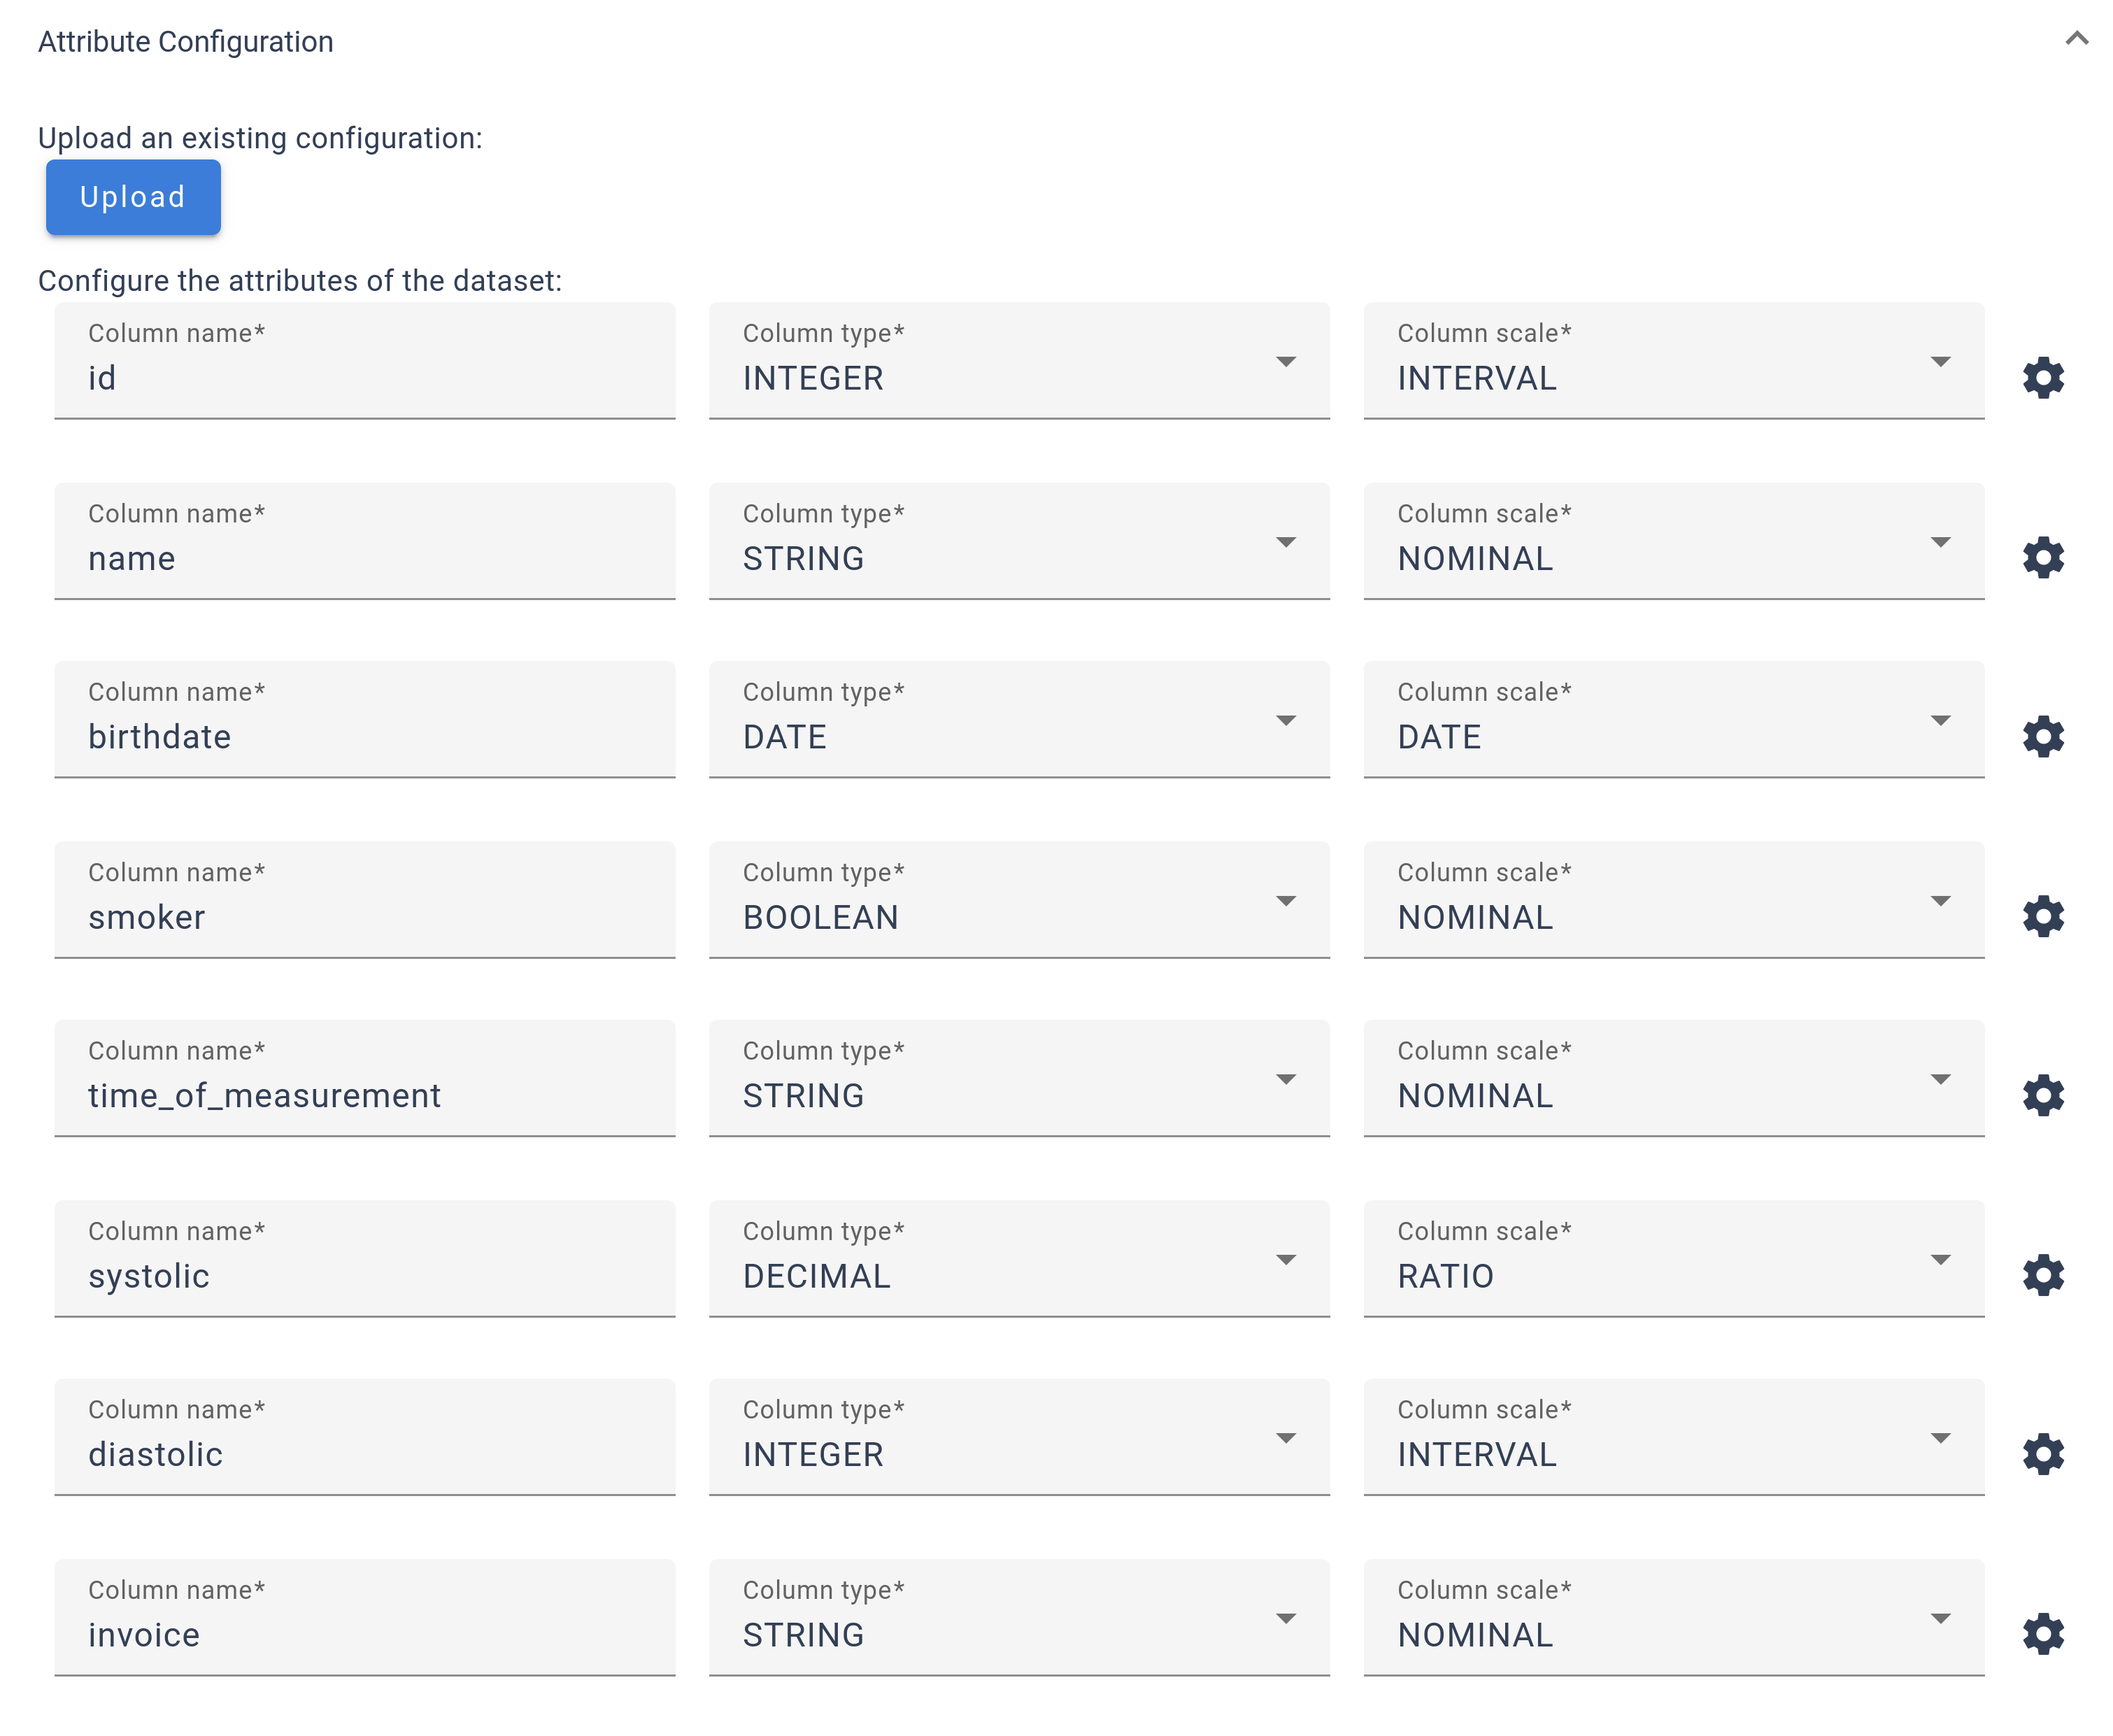 The Attribute Configuration allows you to adjust settings for each attribute in your dataset, including configuring the column name, type, and scale. A
 ![]() icon is available for accessing more advanced configurations. While the platform provides initial estimates for these settings, it’s important for users to review and verify them for accuracy. If you have received an existing configuration for your dataset, you can upload it with the
icon is available for accessing more advanced configurations. While the platform provides initial estimates for these settings, it’s important for users to review and verify them for accuracy. If you have received an existing configuration for your dataset, you can upload it with the  button.
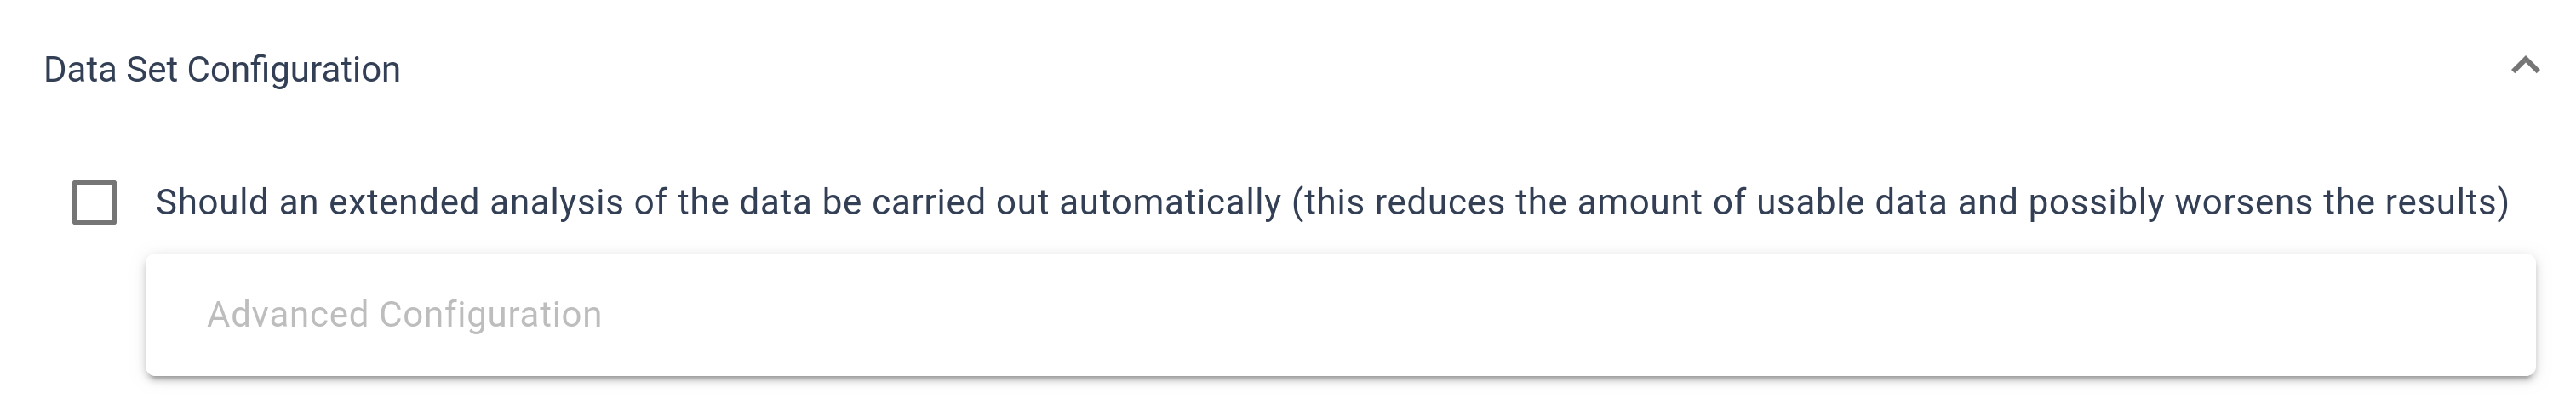 The Dataset Configuration section includes an option to perform an additional analysis, which can be toggled with a checkbox. Keep in mind that opting for this analysis limits the volume of data available for use in models later on.
When your configuration is complete, confirm by clicking the  button.
Validating Data
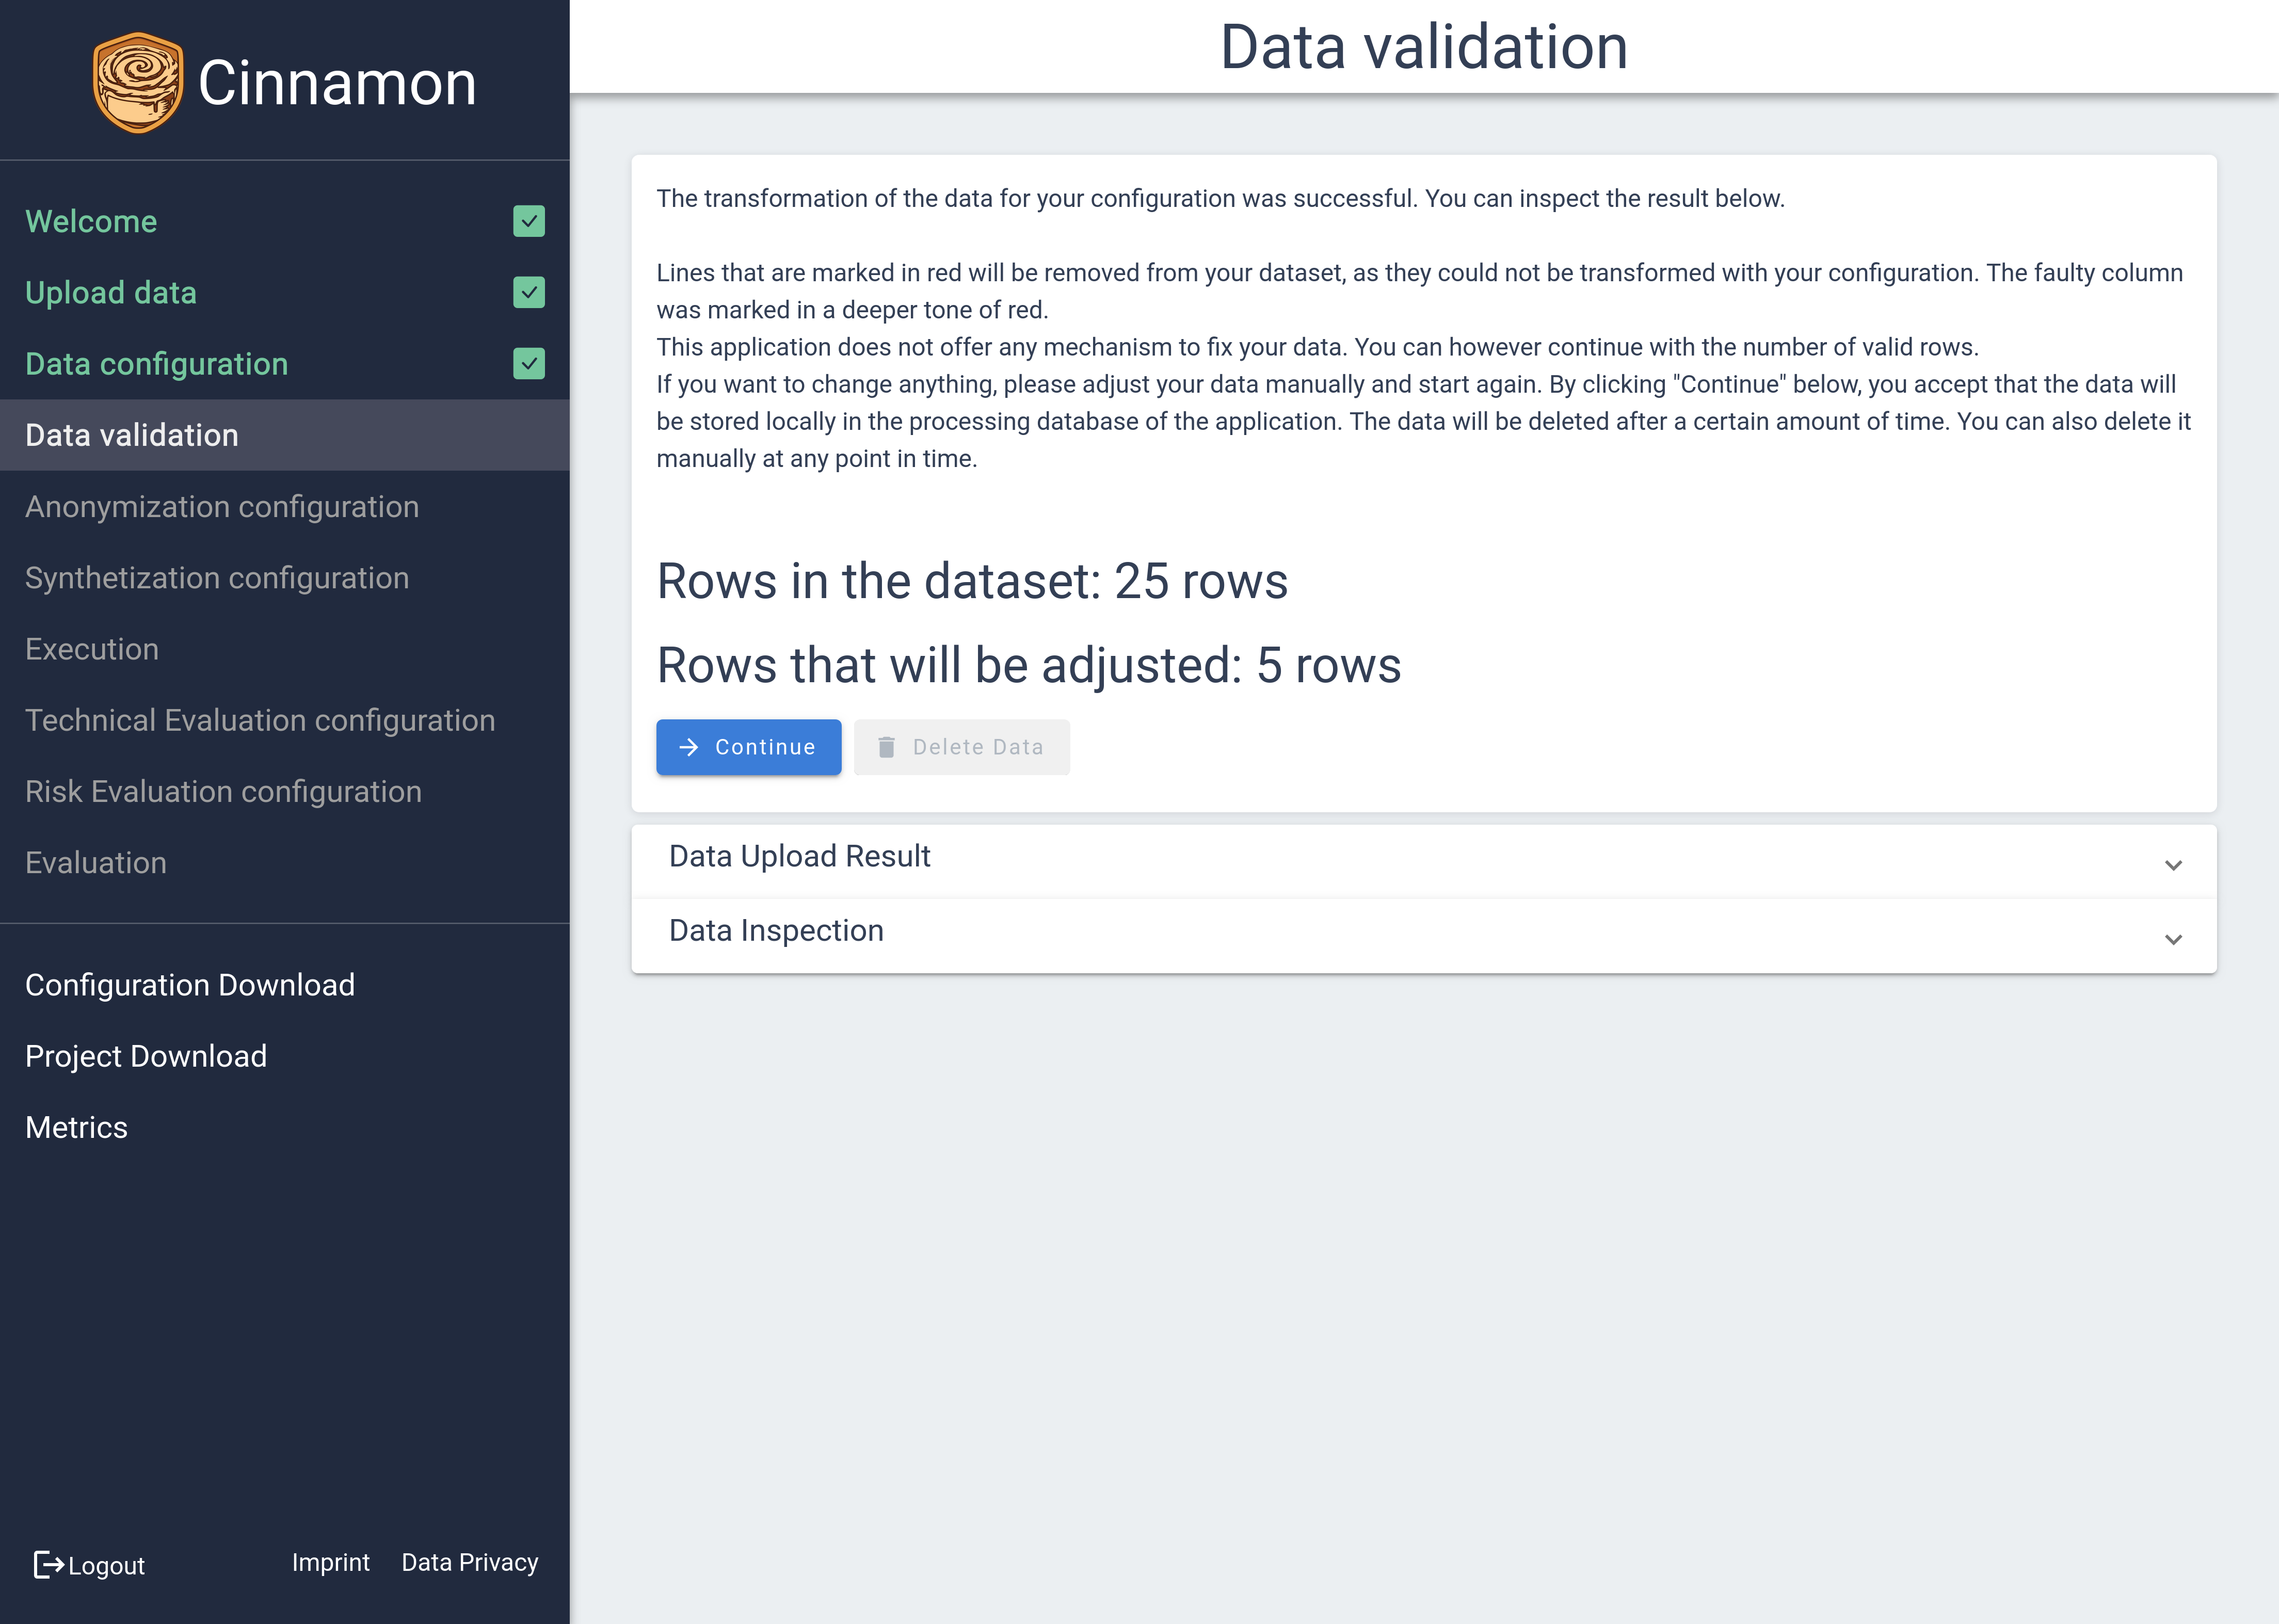 The Data Validation feature provides a comprehensive view of your dataset’s integrity, starting with a summary section that offers an overview of the validation process. It clearly details the total number of rows, alongside how many rows have been validated as correct and how many are set to be adjusted. Beneath this summary, you’ll find two additional sections — A Dataset Overview and a statistical attribute inspection — which are initially collapsed for a cleaner interface.
Dataset Overview
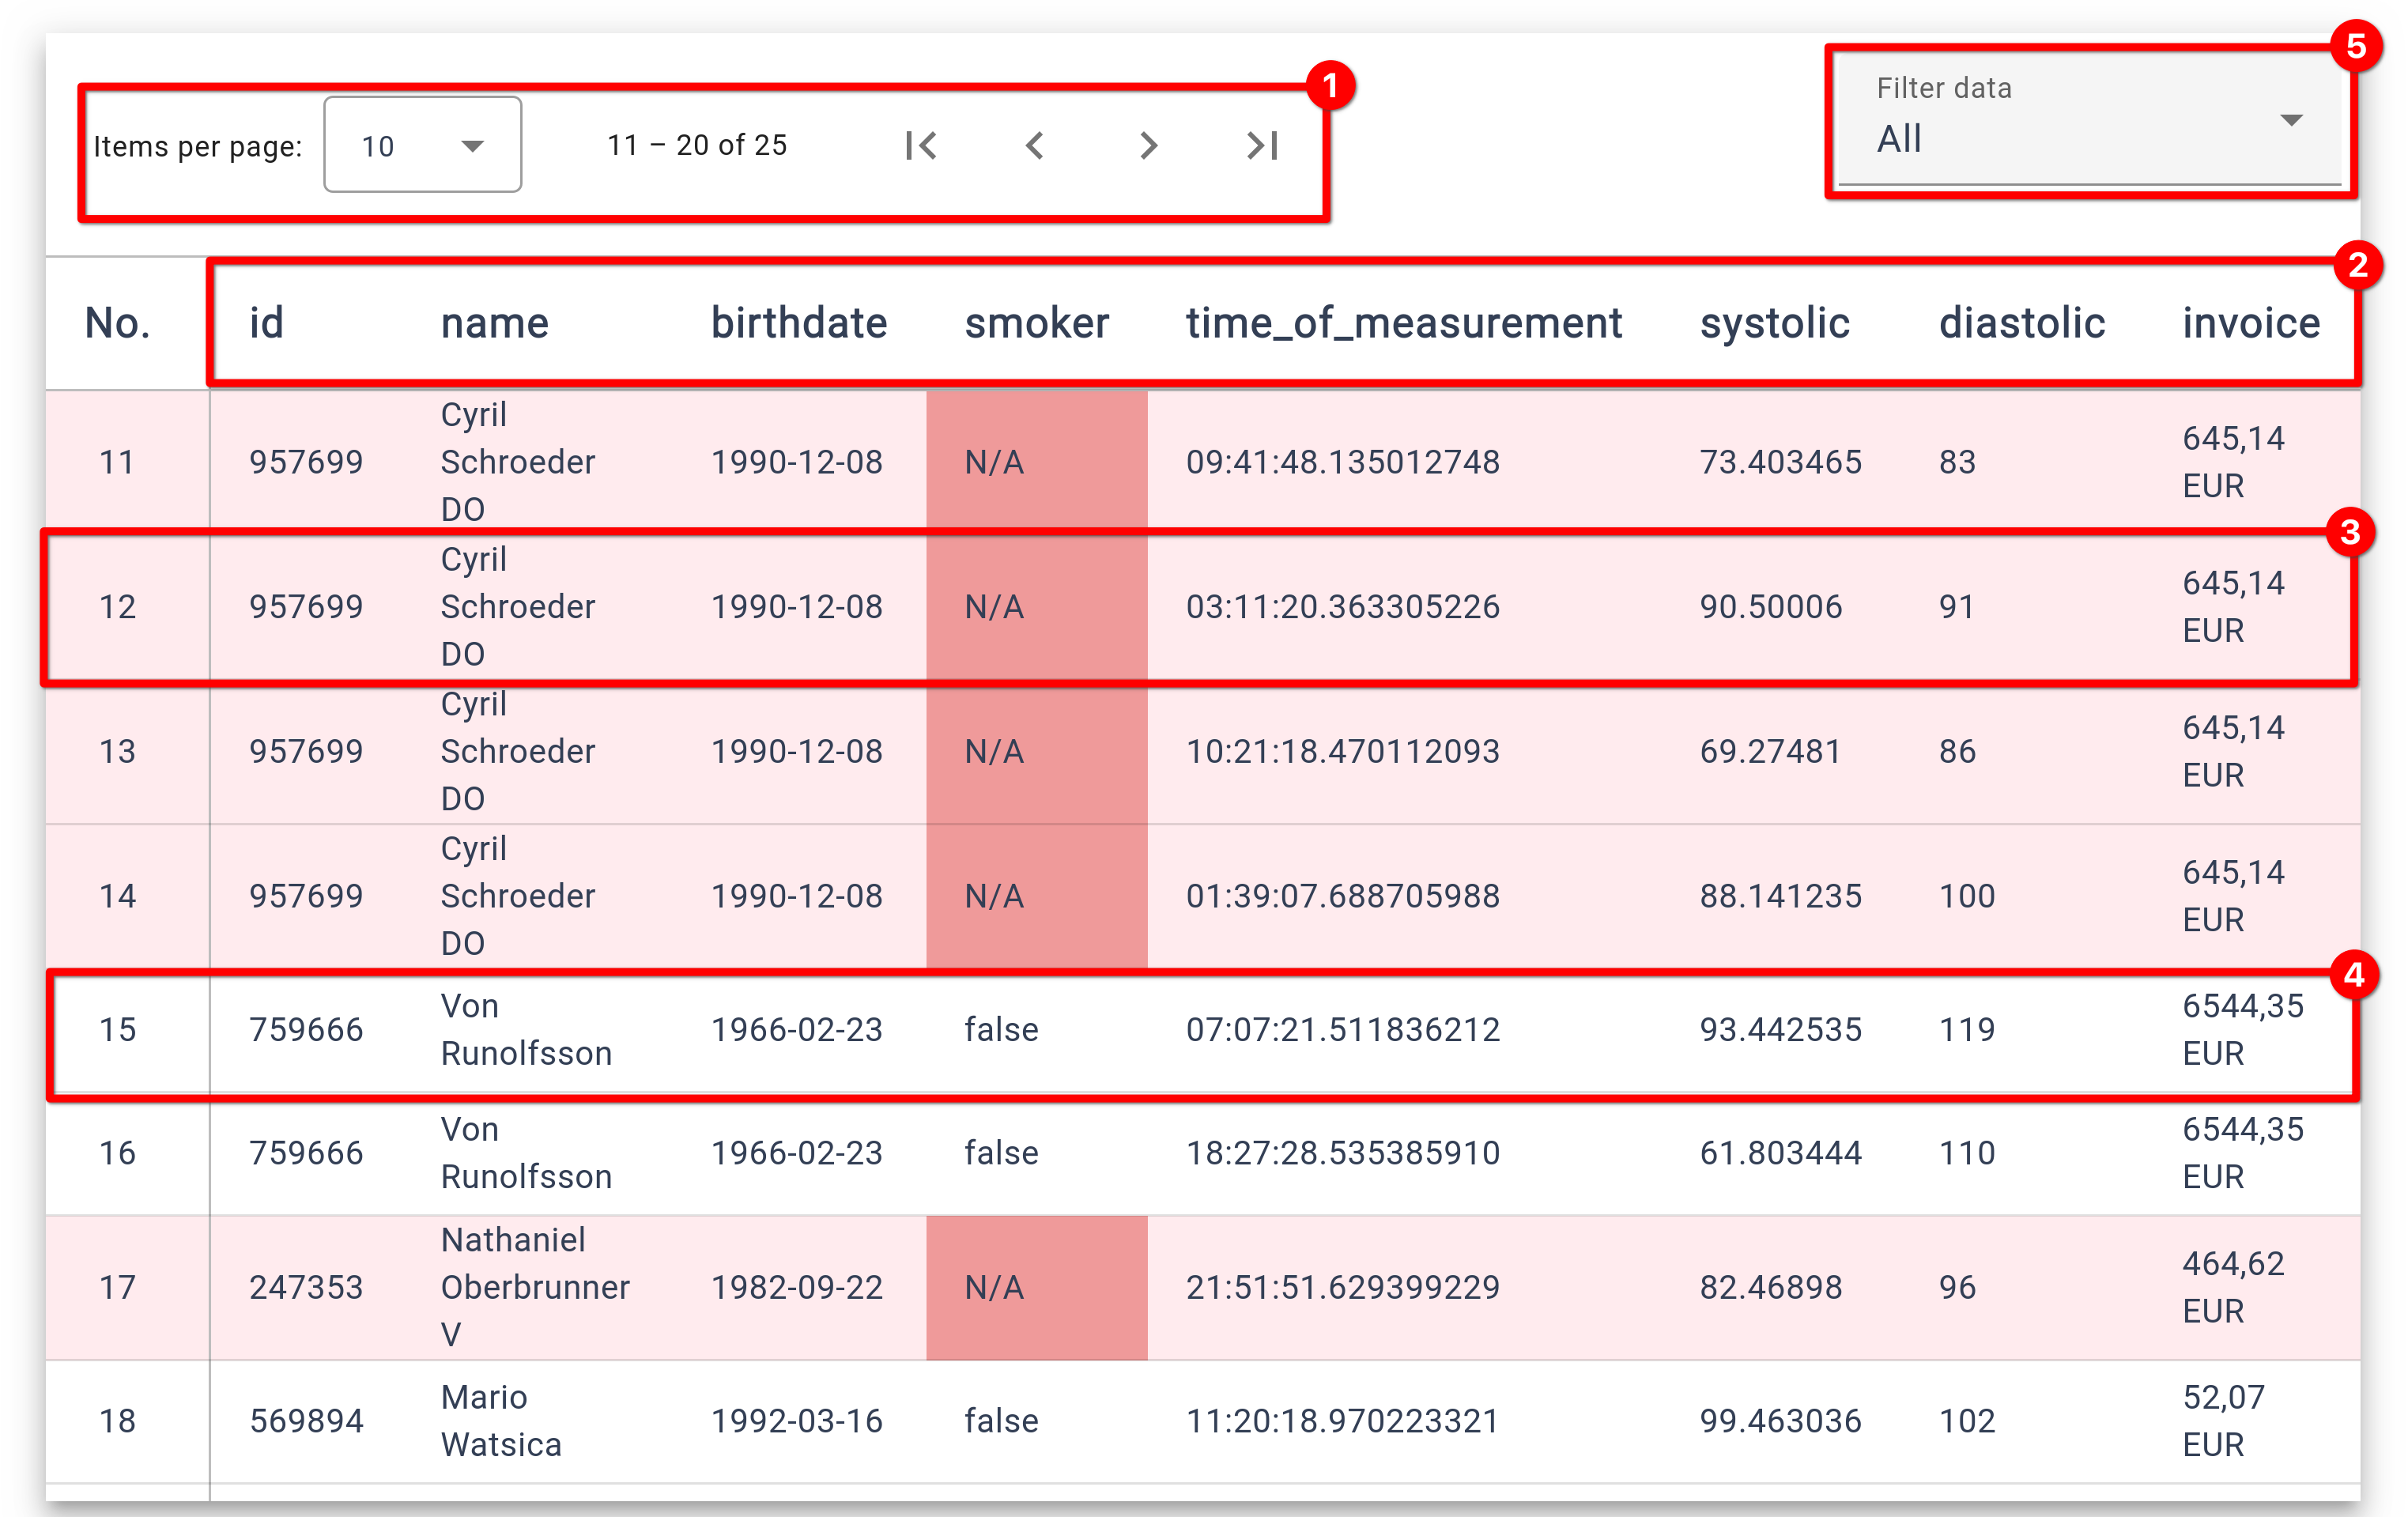
Within the Dataset Overview, your data is presented in a tabular format, utilizing pagination to manage larger datasets by displaying only parts at a time. This table highlights any rows where errors occurred during validation, with specific cells marked to guide your attention. Additionally, you can filter the displayed rows to see only valid or invalid entries, which aids in efficiently tracking and resolving errors.
❶
Pagination - Navigate through the dataset and adjust the number of rows displayed.
❷
Header Column with the name of the attributes.
❸
An invalid row - The row is highlighted in a slight red tint. The invalid cell is highlighted in a more deep red tone.
❹
A valid row - It is not highlighted at all.
❺
A dropdown to filter the shown values - You can filter for invalid, valid or both.
Statistical Attribute Inspection
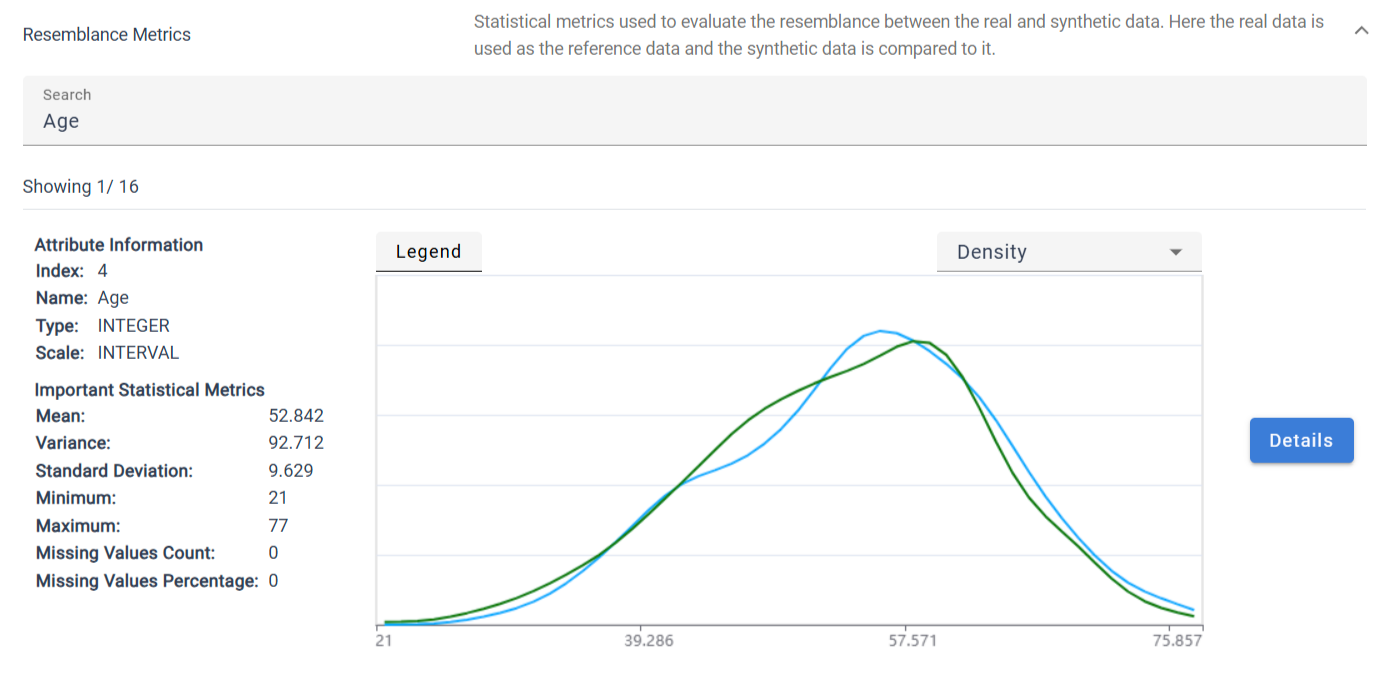
The Attribute Inspection section offers an in-depth analysis of each attribute, presenting a variety of statistical parameters to help you understand the characteristics of your data. It includes visual graphs to illustrate attribute distributions, which you can customize to display either histograms or density plots.
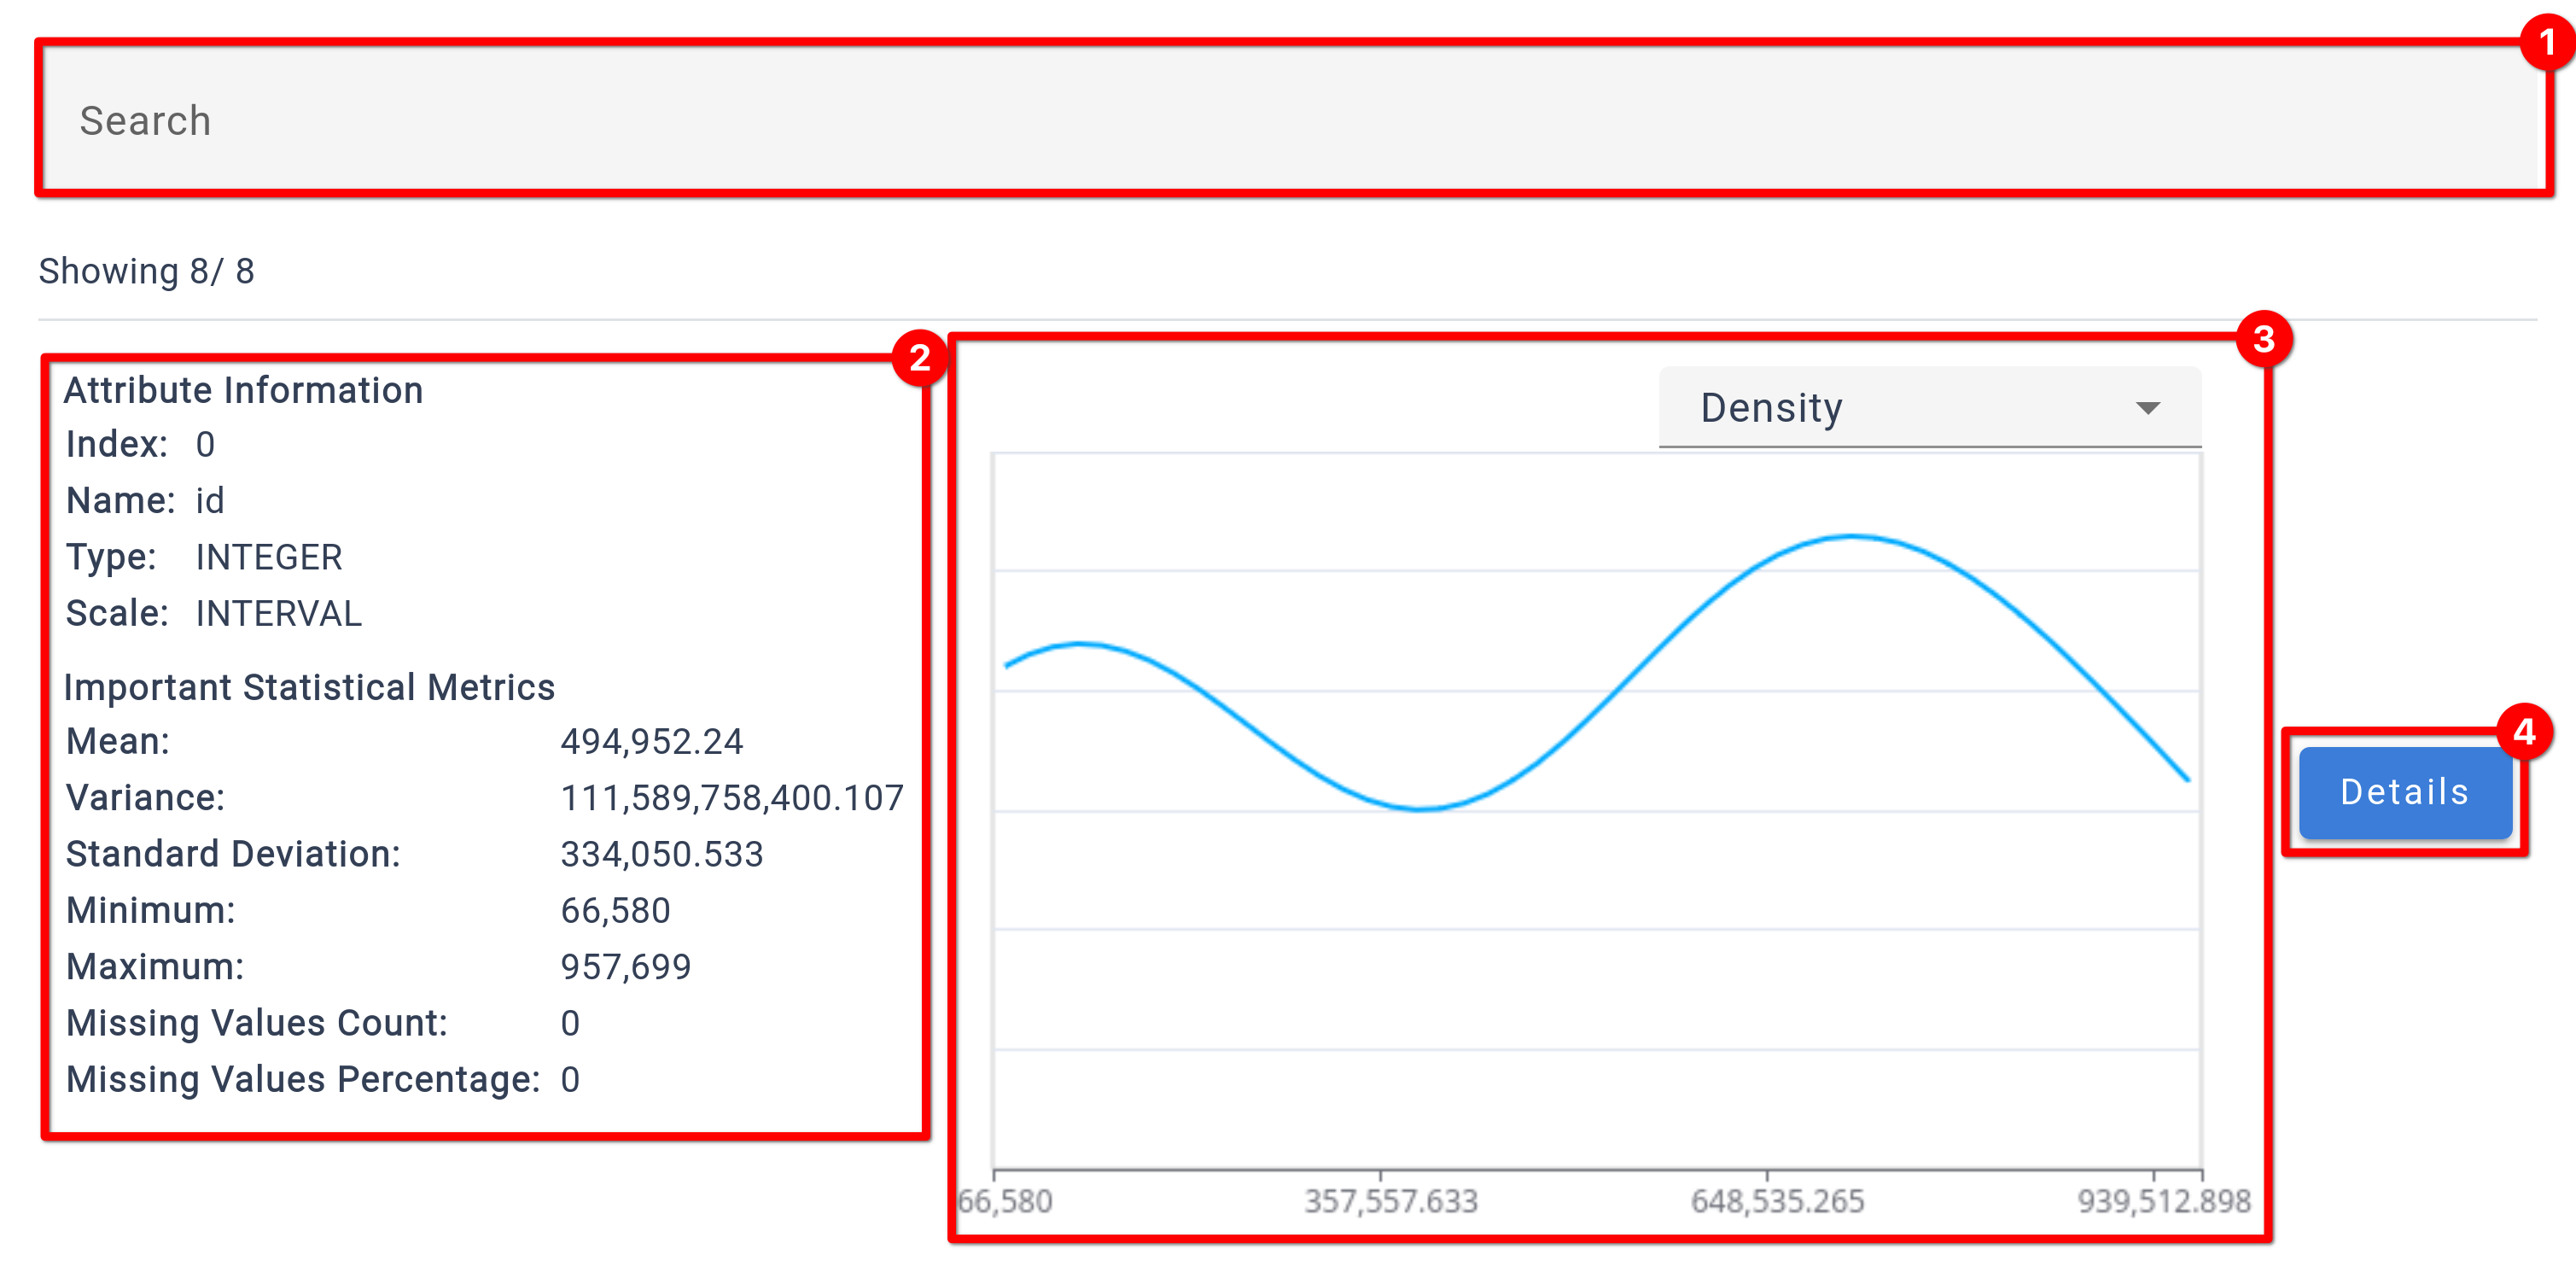
❶
Filter the displayed attribute summary by typing the name of the attribute.
❷
Summary of the most important information for the attribute. The statistical parameters shown depend on the configured attribute type.
❸
Graph for the attribute. The type of graph can be changed with the dropdown. For some attribute types, the graph can not be changed.
❹
Details button opens a pop-up with more information for the attribute.
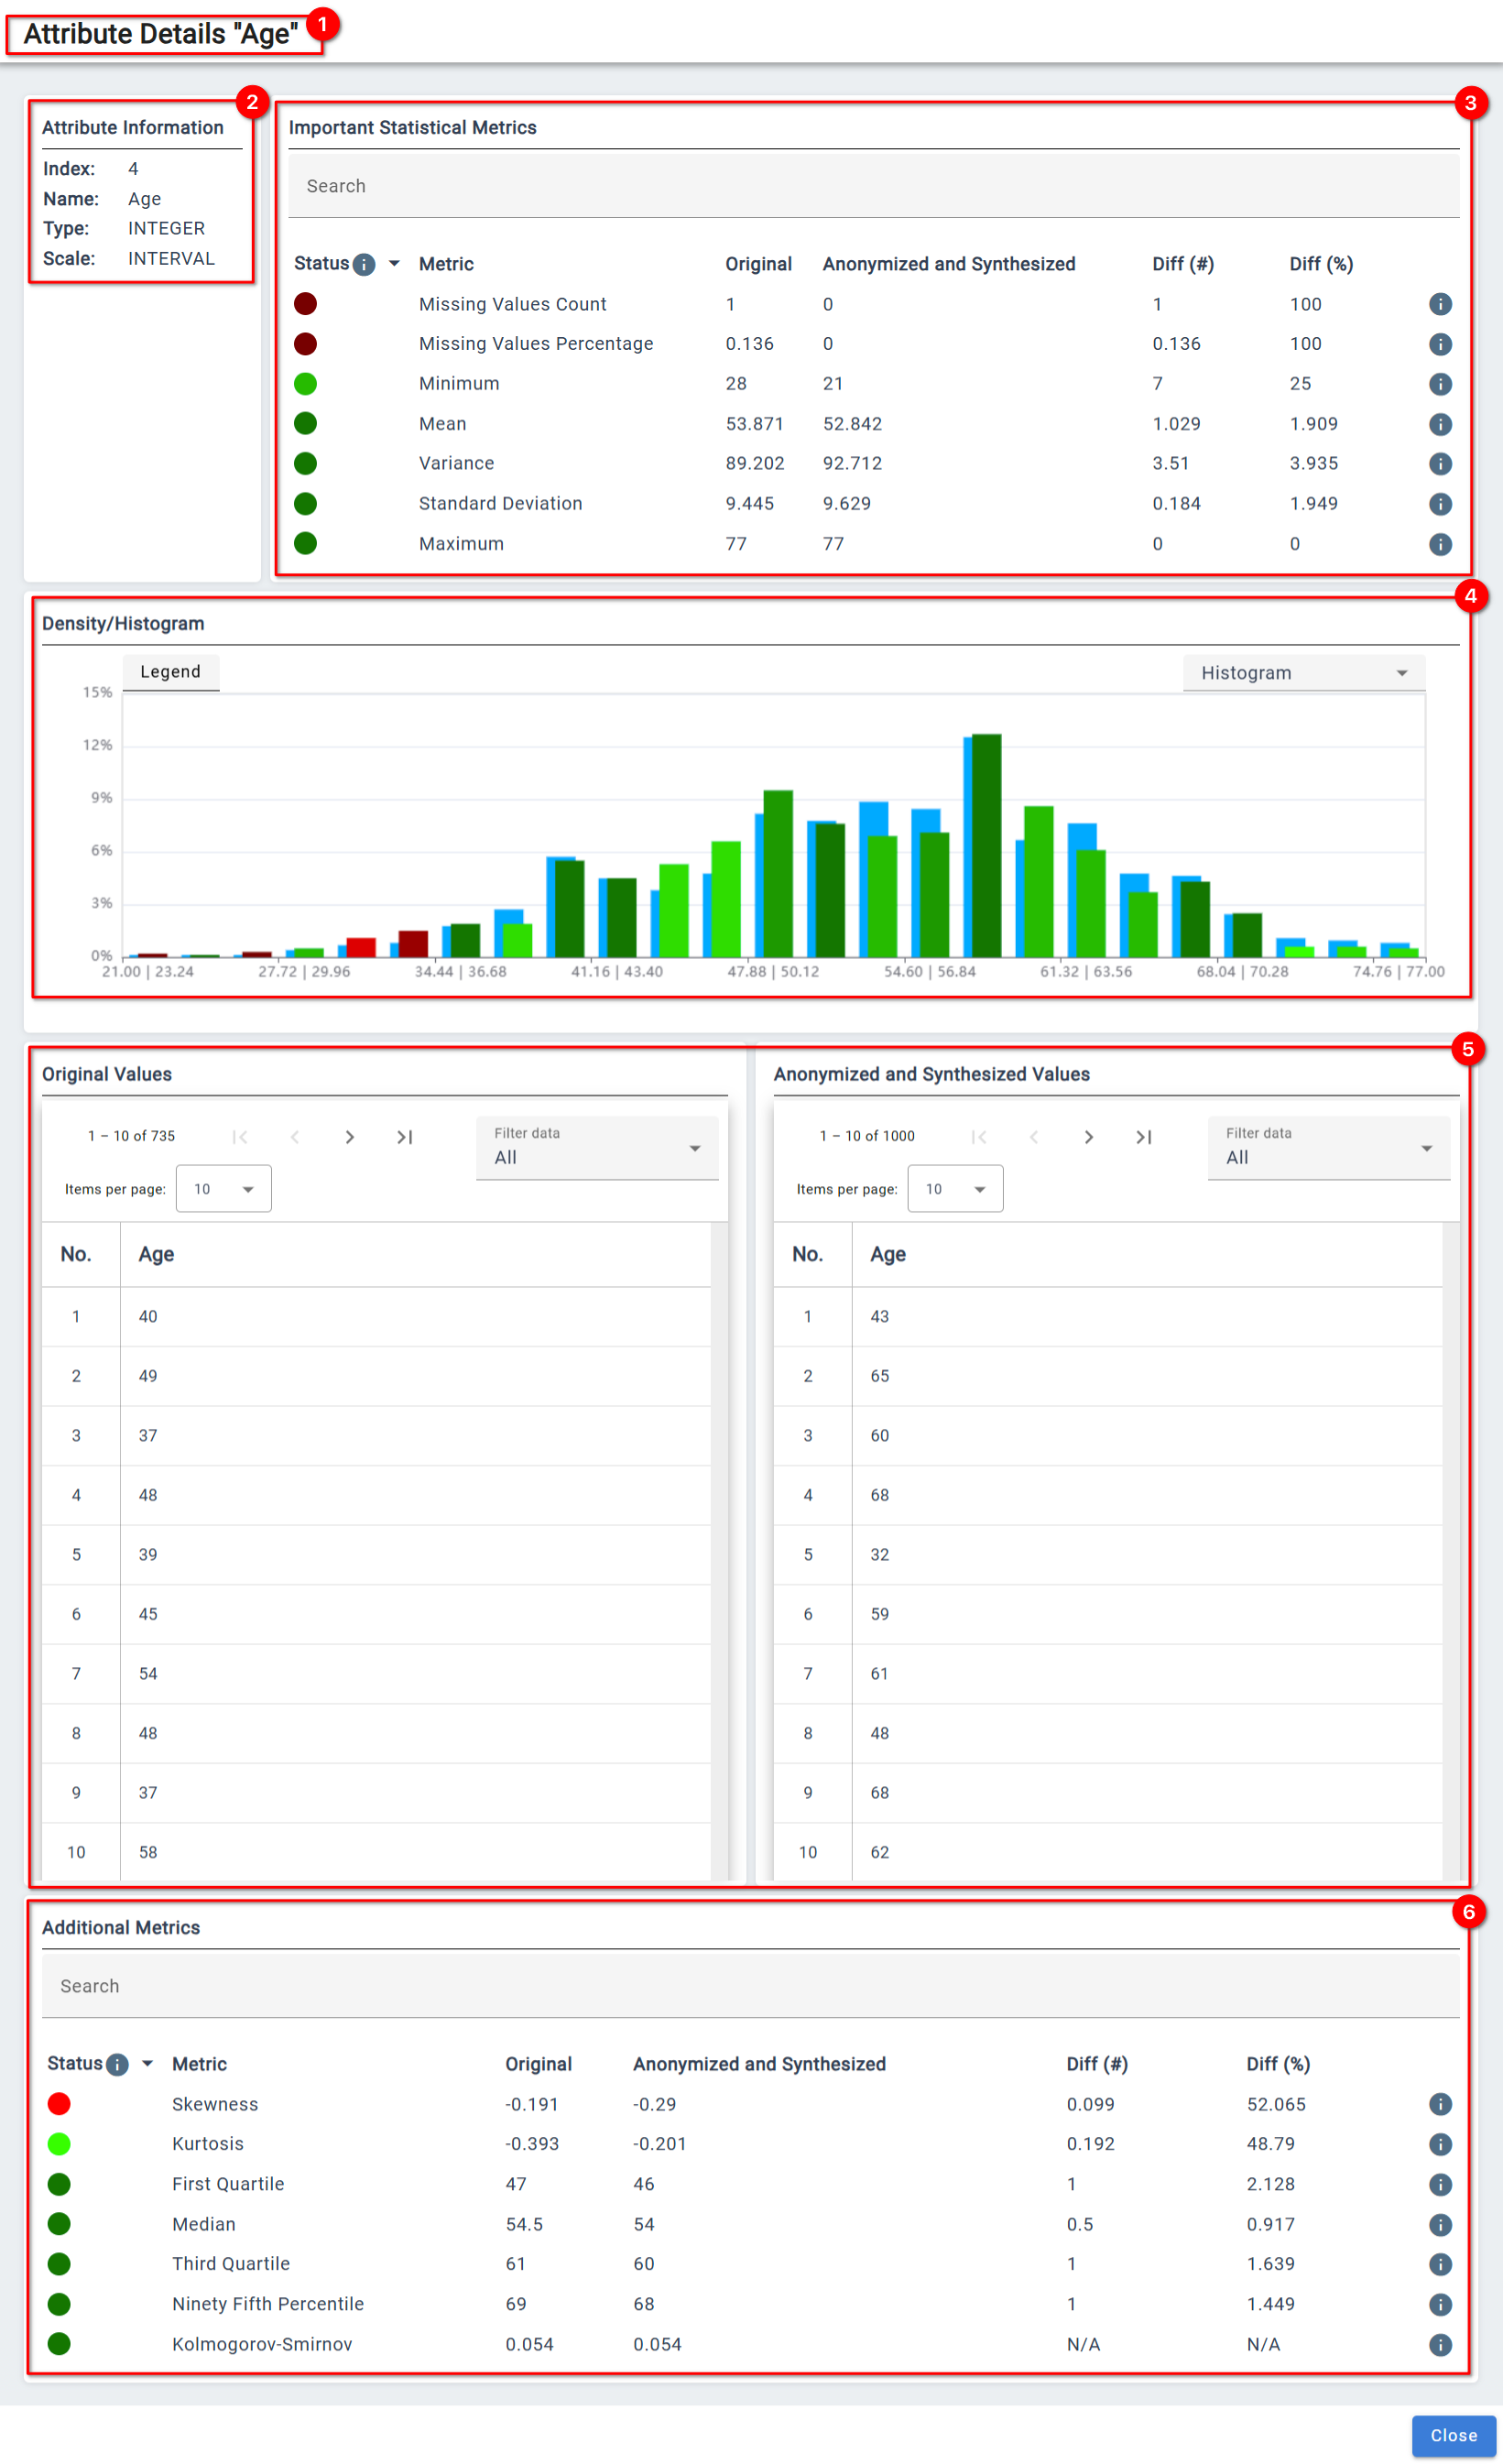
For an even deeper dive, the Details menu provides access to further statistical parameters and more detailed graphs, allowing users to thoroughly investigate and validate their dataset’s attributes.
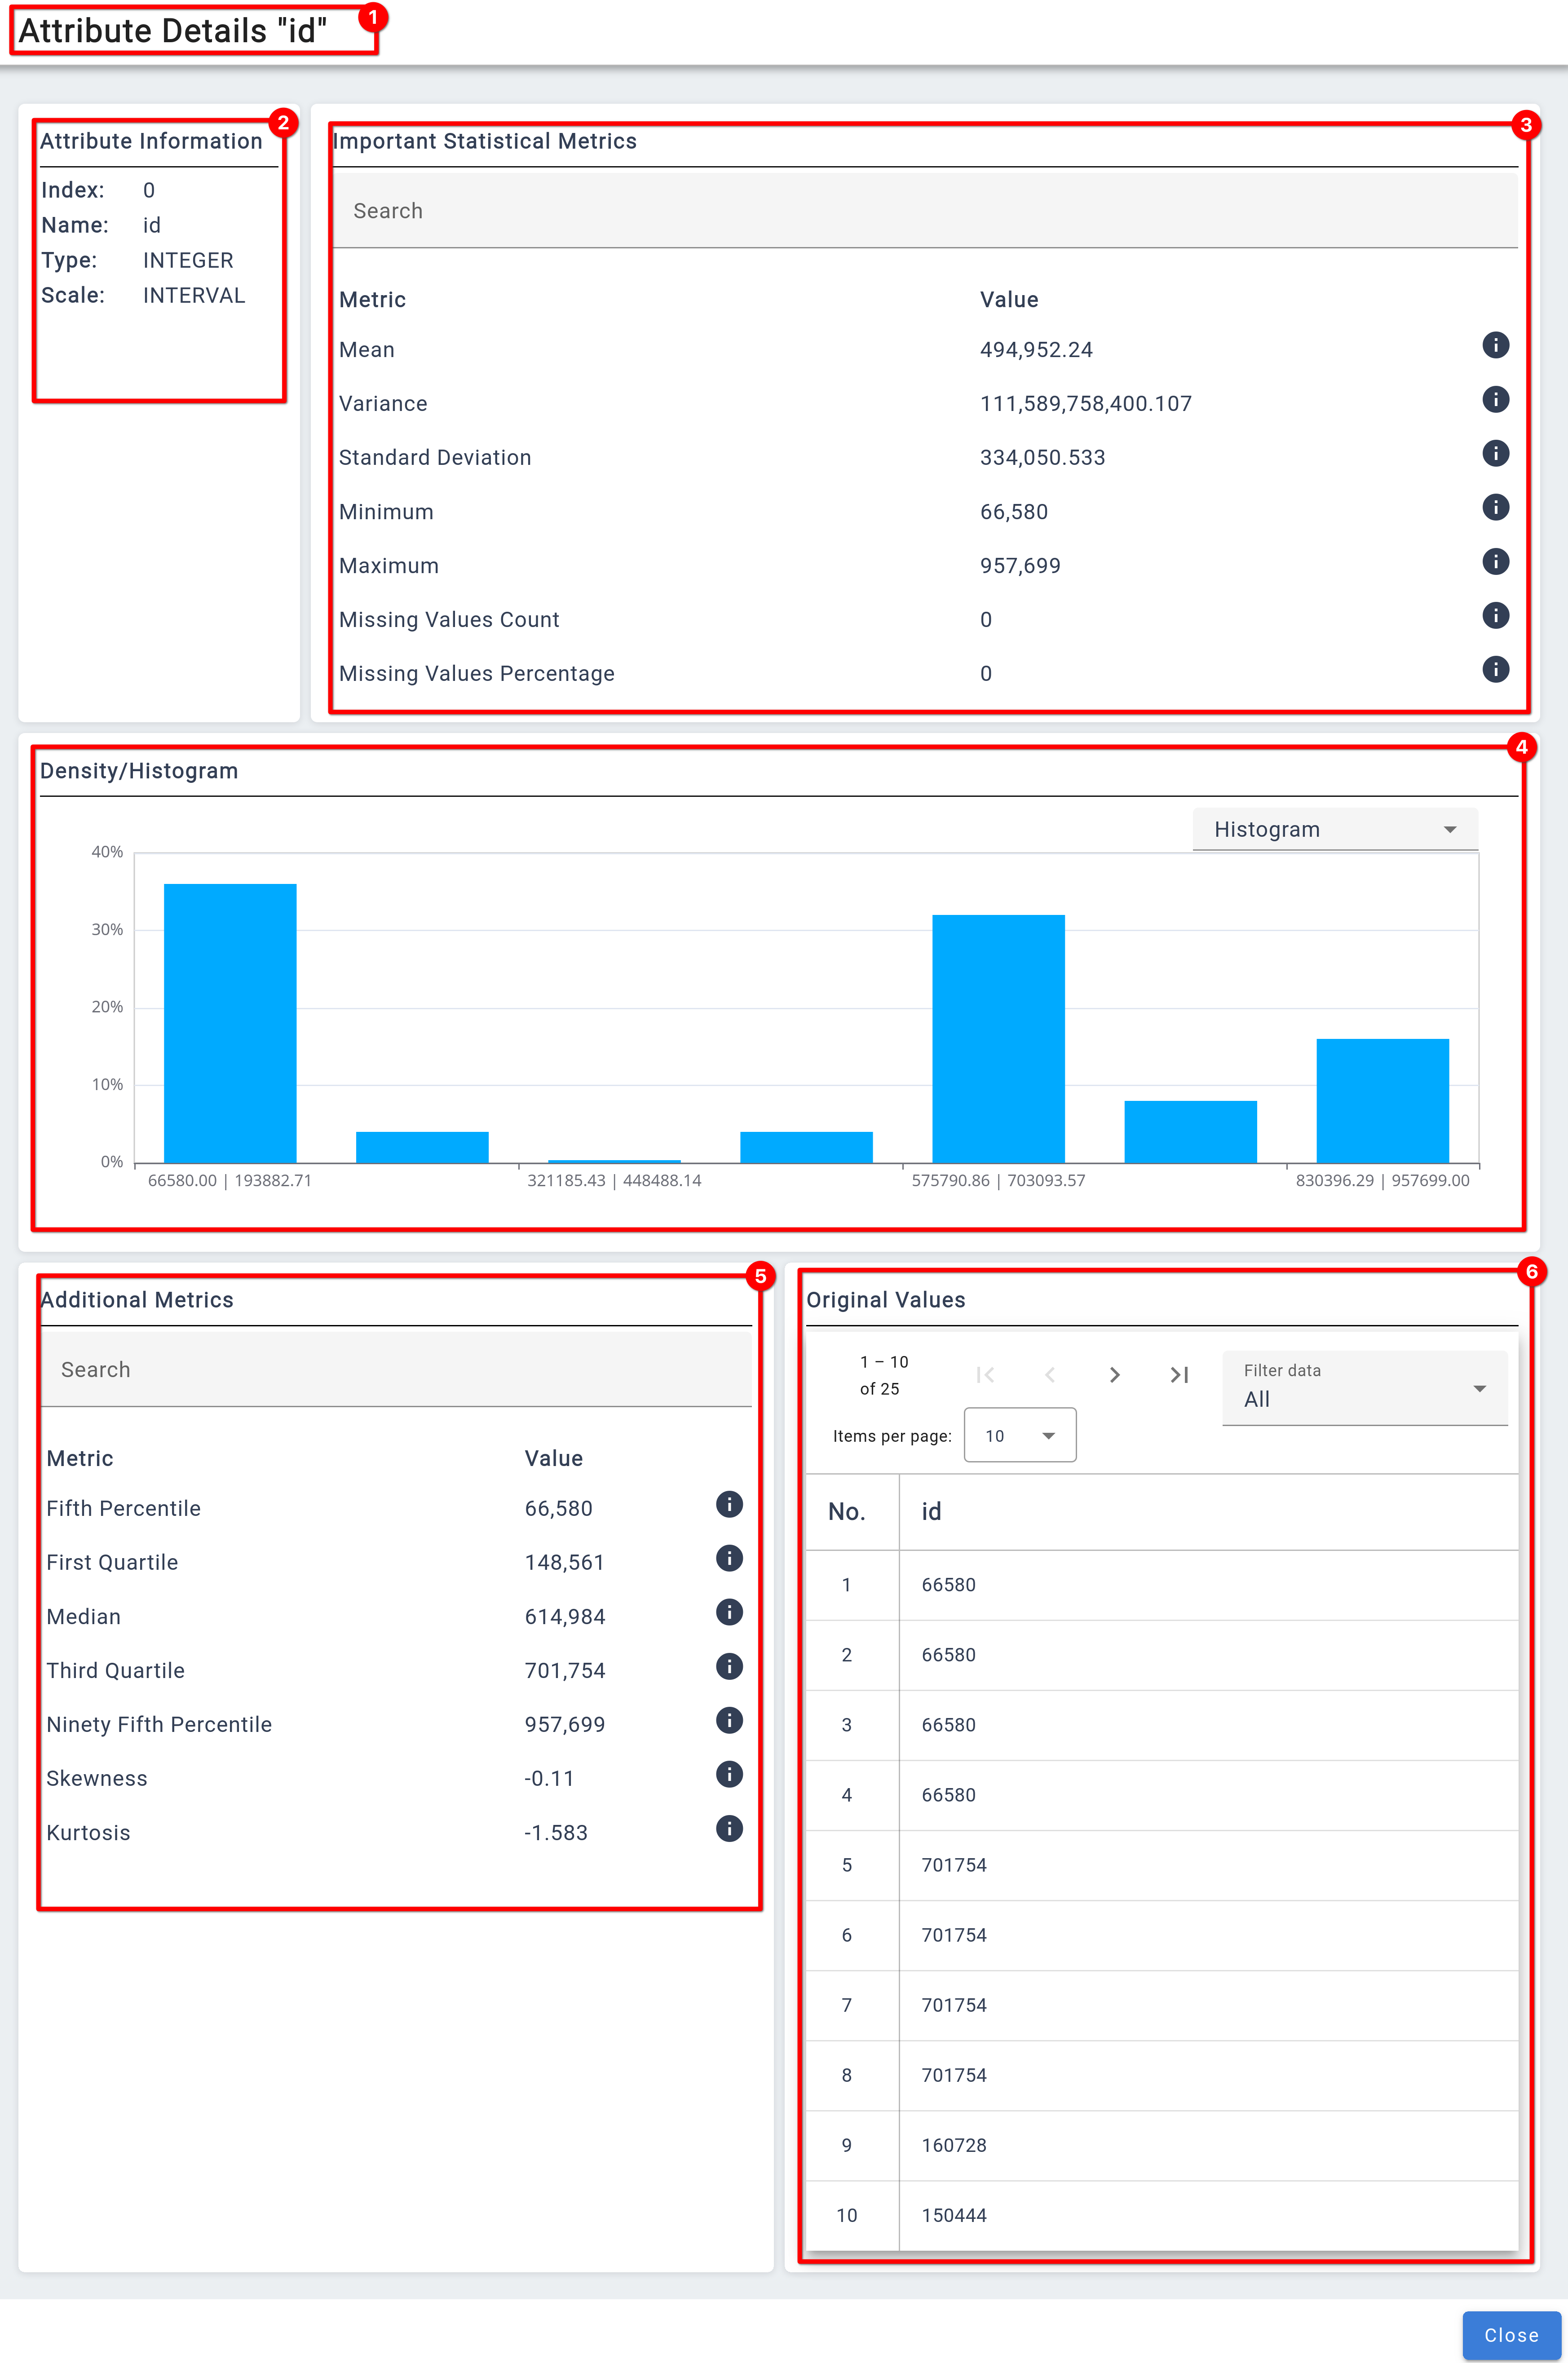
❶
Indicator for the attribute for which details are shown.
❷
Overview of the settings for the attribute
❸
Overview for important metrics (These are also shown in the general overview).
❹ A more detailed view of the graphs in the overview.
❺ Additional metrics, that can give more information for an attribute.
❻ A table for values of the attribute. Can be used to investigate outliers, for example.
General Algorithm Configuration Information
In our system, algorithms are designed to register themselves through an API, with their specifications defining the necessary configuration fields. This dynamic registration process enables the configuration pages to be constructed dynamically, tailored to the specific requirements of each algorithm with a range of input elements.
The configuration pages utilize three primary input types: input fields, checkboxes, and list attributes. These elements ensure flexibility and precision in setting up configurations.
Inputs
 Checkboxes
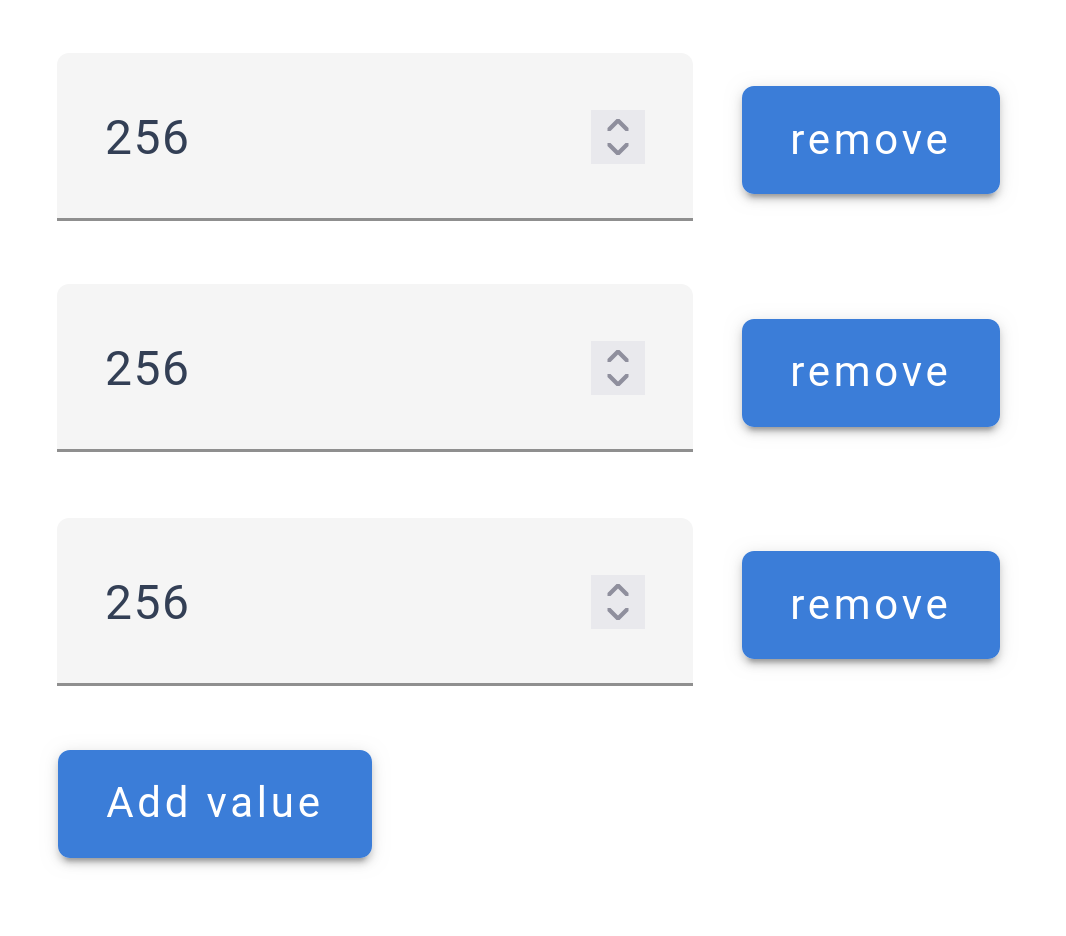
 List Inputs
 For list attributes, an additional menu can be accessed via the
 ![]() icon, allowing for detailed customization within the list.
icon, allowing for detailed customization within the list.
To aid users, each input is accompanied by an ![]() icon. Clicking this icon provides additional context and details about the field, ensuring users have all the necessary information to make informed configuration decisions.
icon. Clicking this icon provides additional context and details about the field, ensuring users have all the necessary information to make informed configuration decisions.
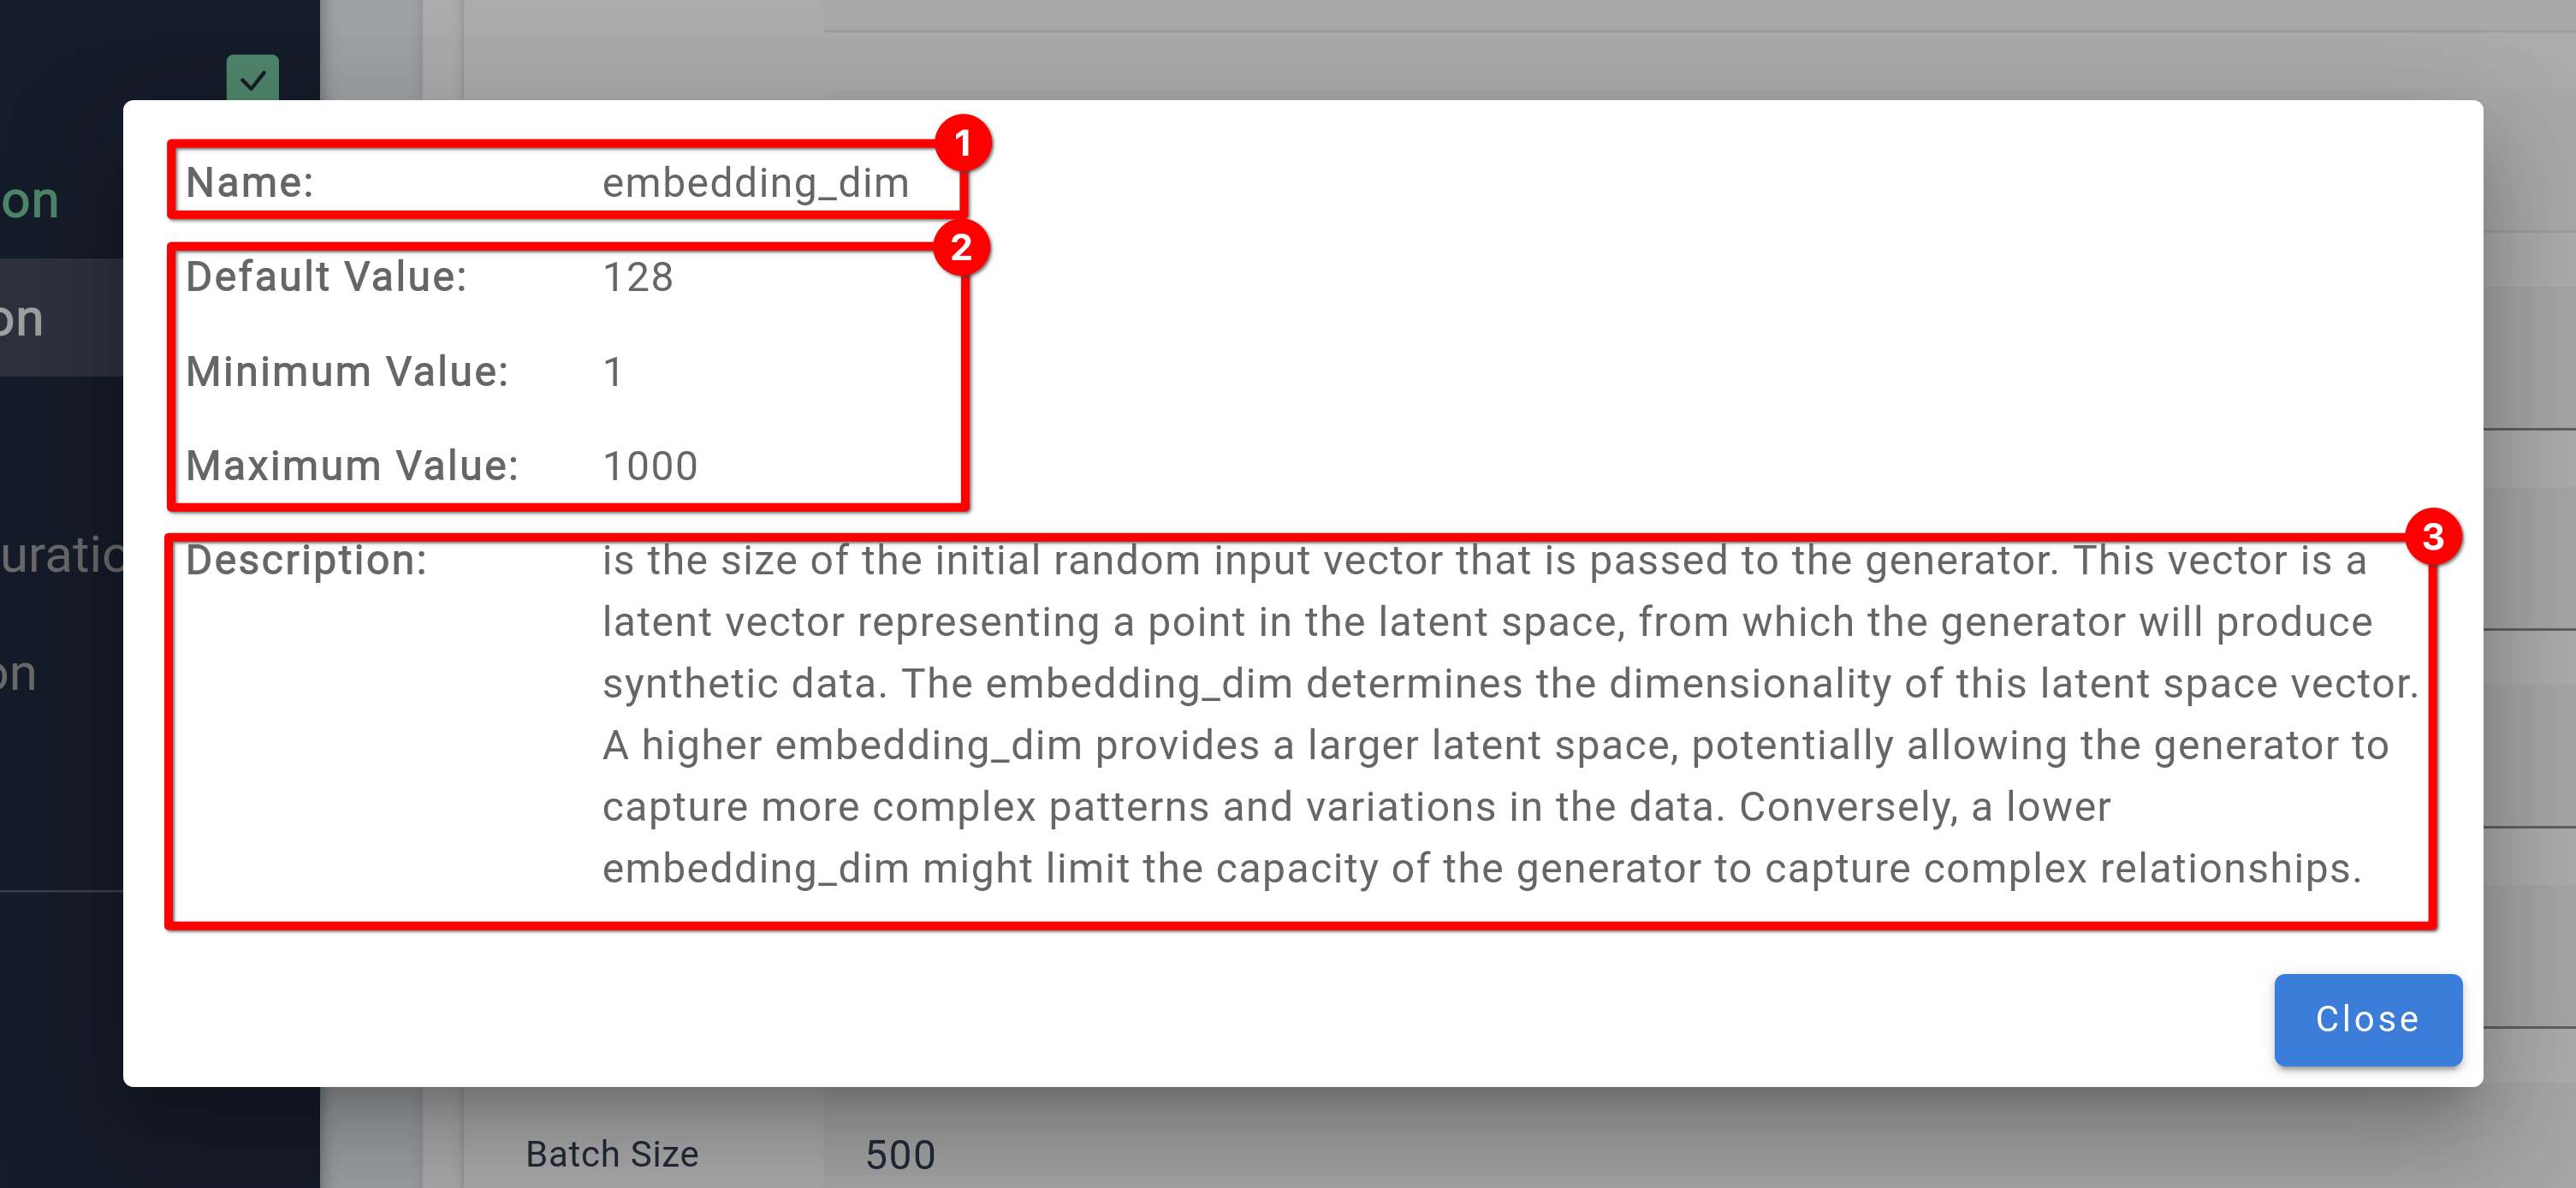
❶ The name of the configuration field.
❷ Range values for the input configuration. Shows a minimum, maximum and default value for every configuration
❸
A detailed description for every configuration field. This includes the impact of changing the configuration as well as information how to find a good value for your data.
Anonymization Configuration
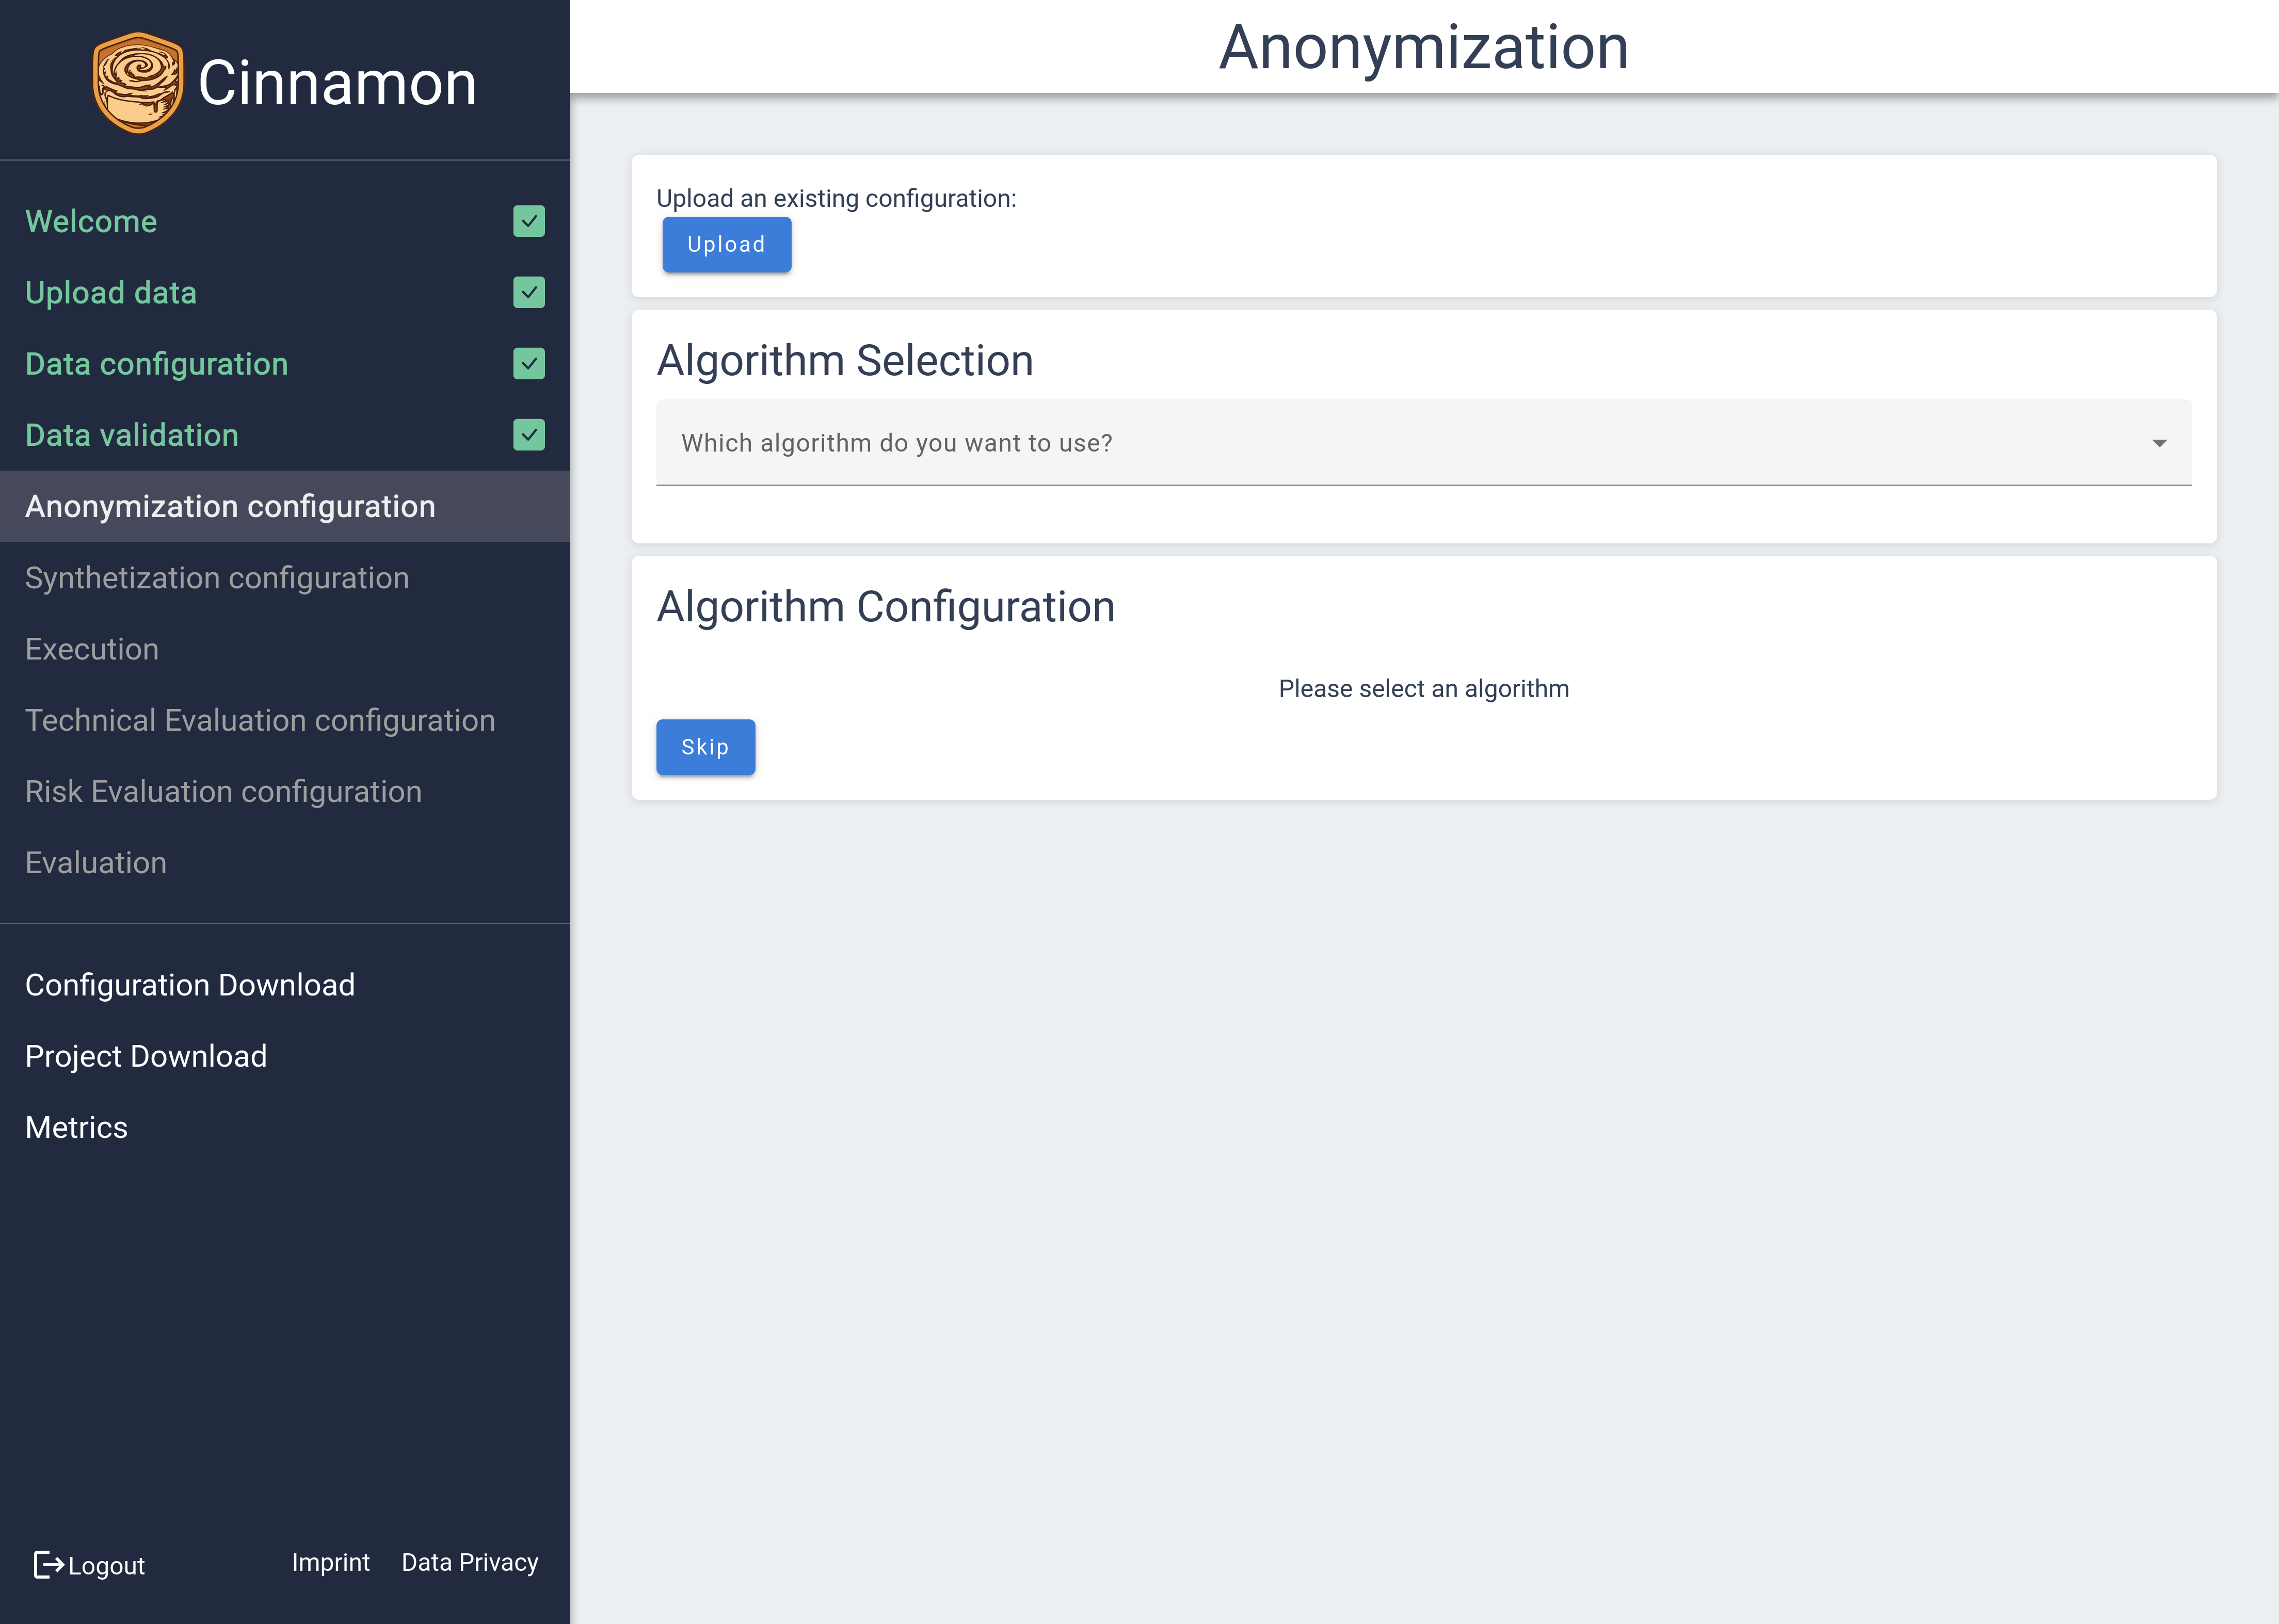 The Anonymization Configuration page is your control center for selecting and setting up the methods used to protect your data. To start, you must first select an anonymization method, as initially, no configurations are preset. Once a method is chosen, the necessary configuration options will appear on the page, enabling a tailored setup according to your requirements.
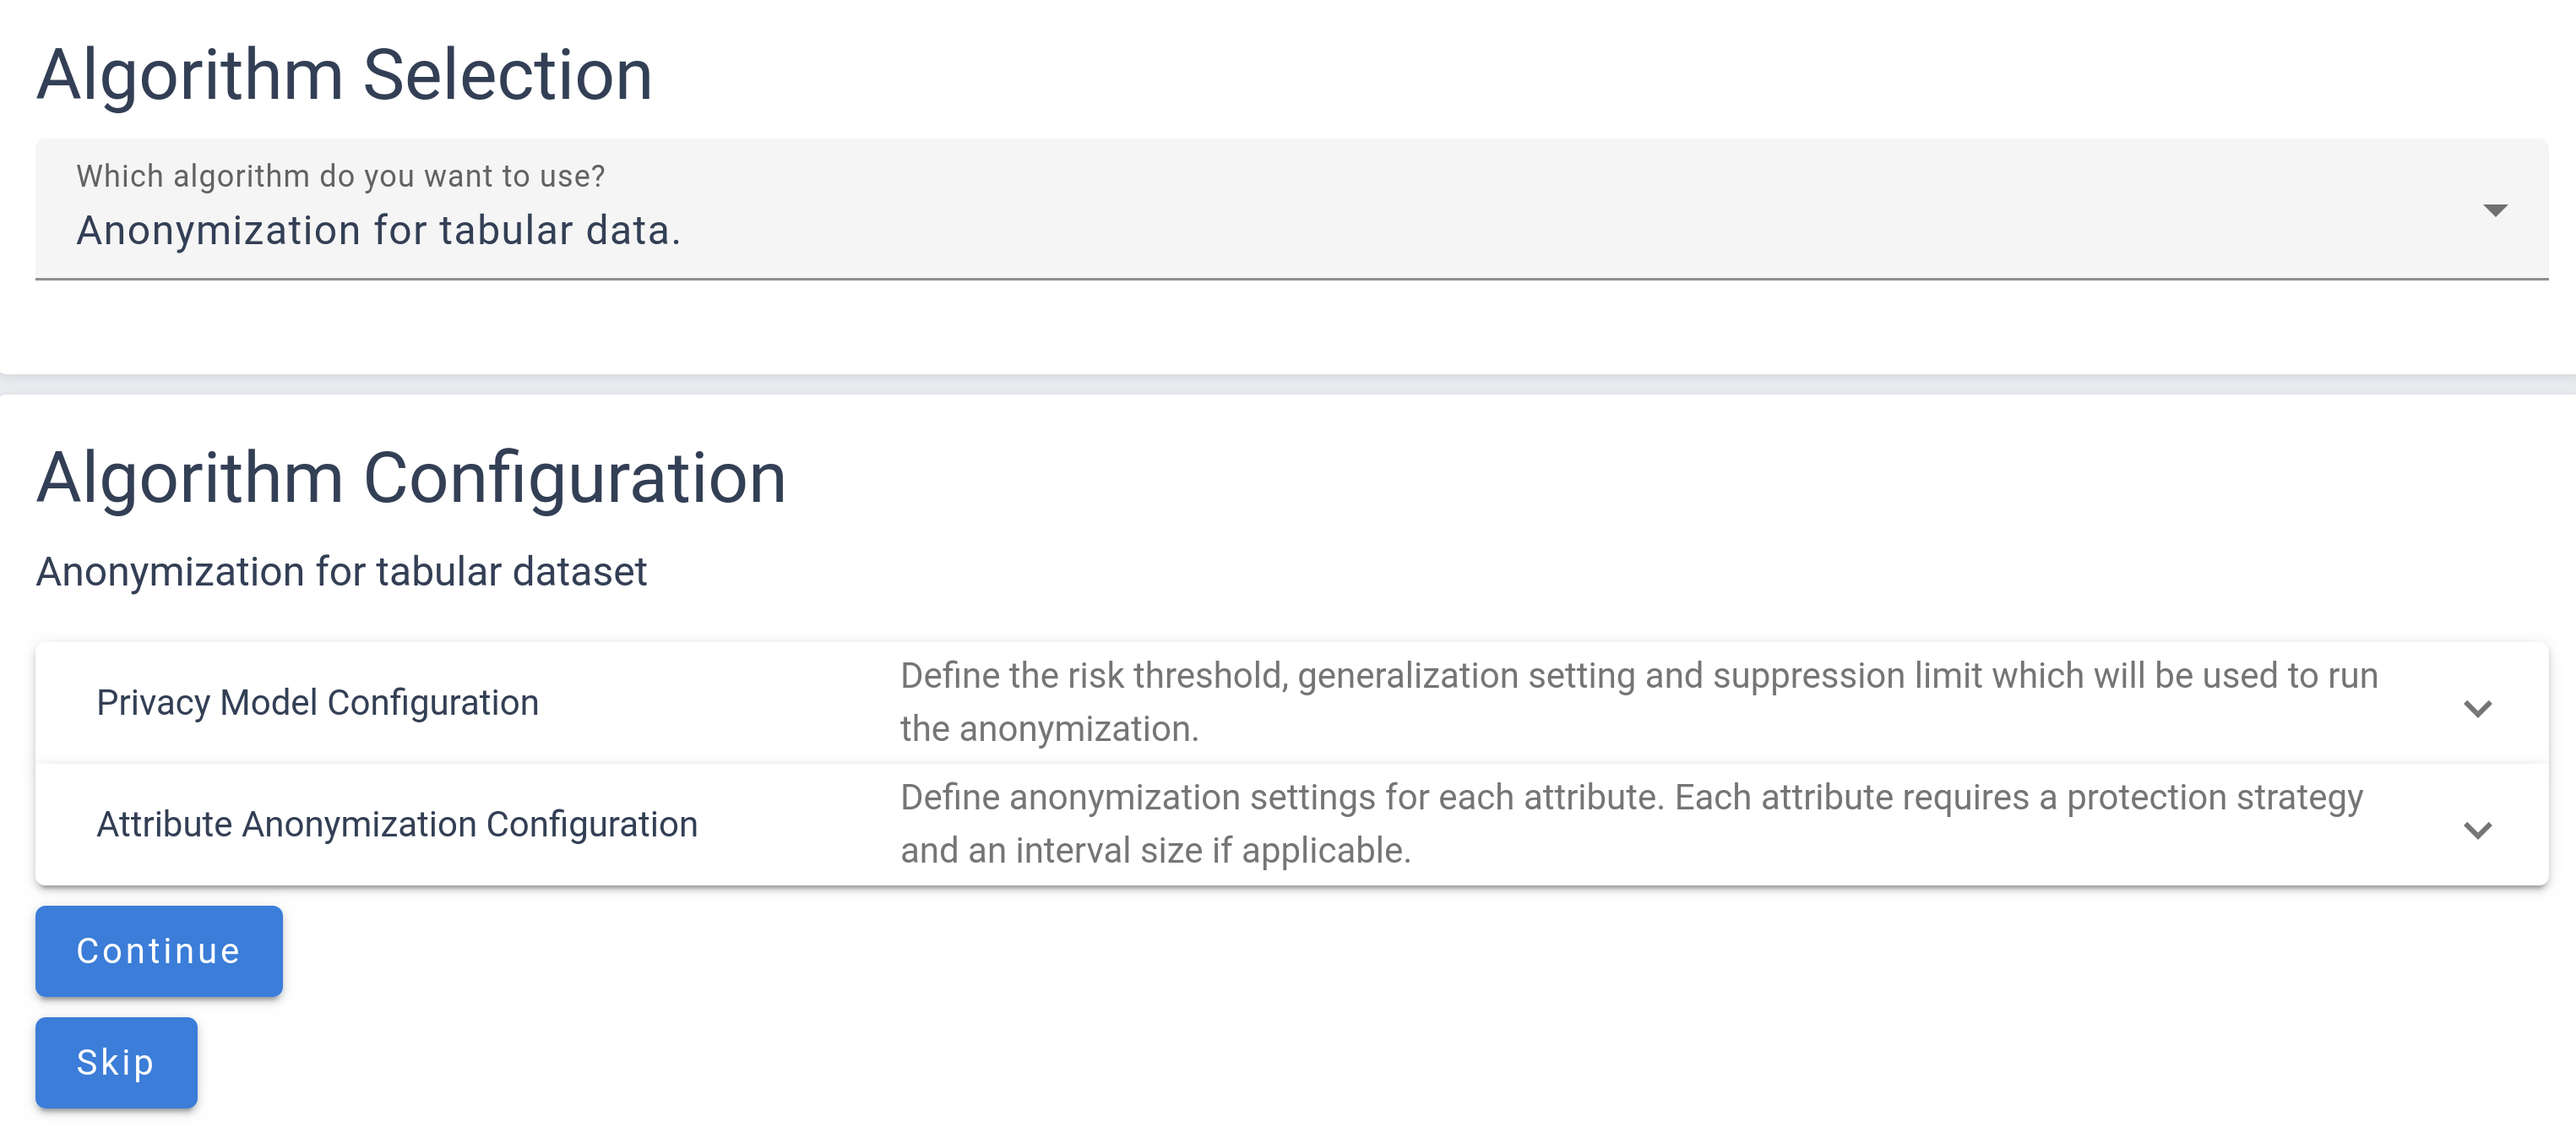
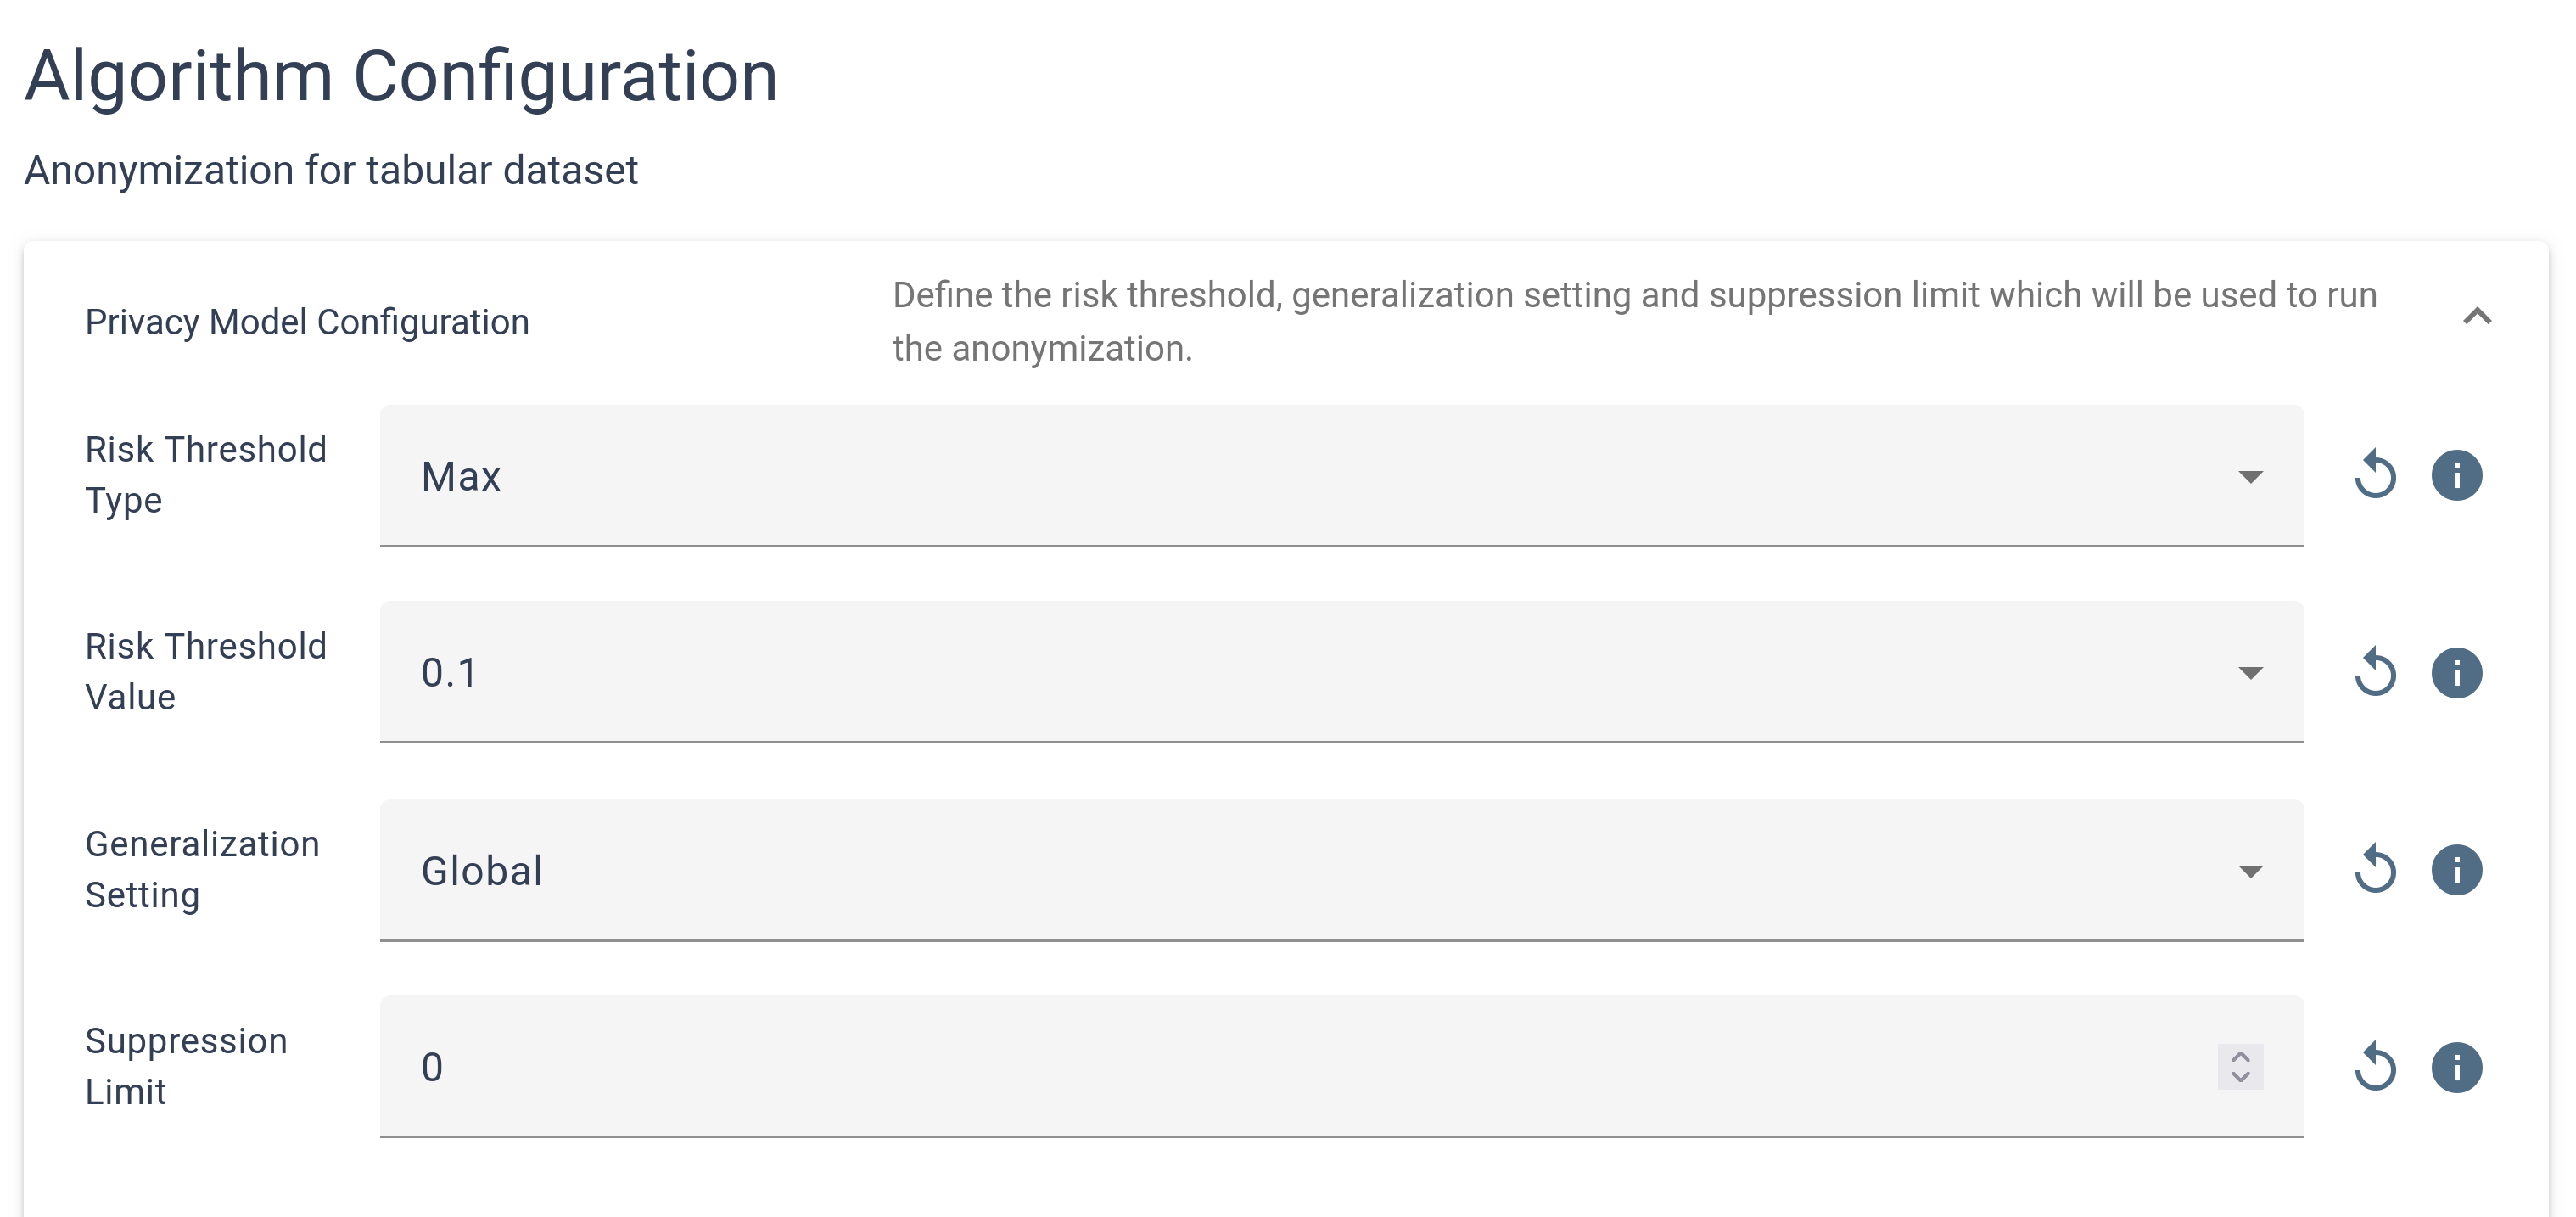
The page is divided into two main sections: Privacy Model Configuration and Attribute Configuration, both initially collapsed for a streamlined view. By clicking on these sections, you can expand them to access detailed configuration options. The Privacy Model Configuration section contains key parameters that directly impact the anonymization results, requiring careful adjustment to ensure effective data protection.
Meanwhile, the Attribute Configuration section allows you to set specific protection rules for each attribute individually. To add attributes to the configuration, they can be selected individually from the drop-down menu or all added at once.
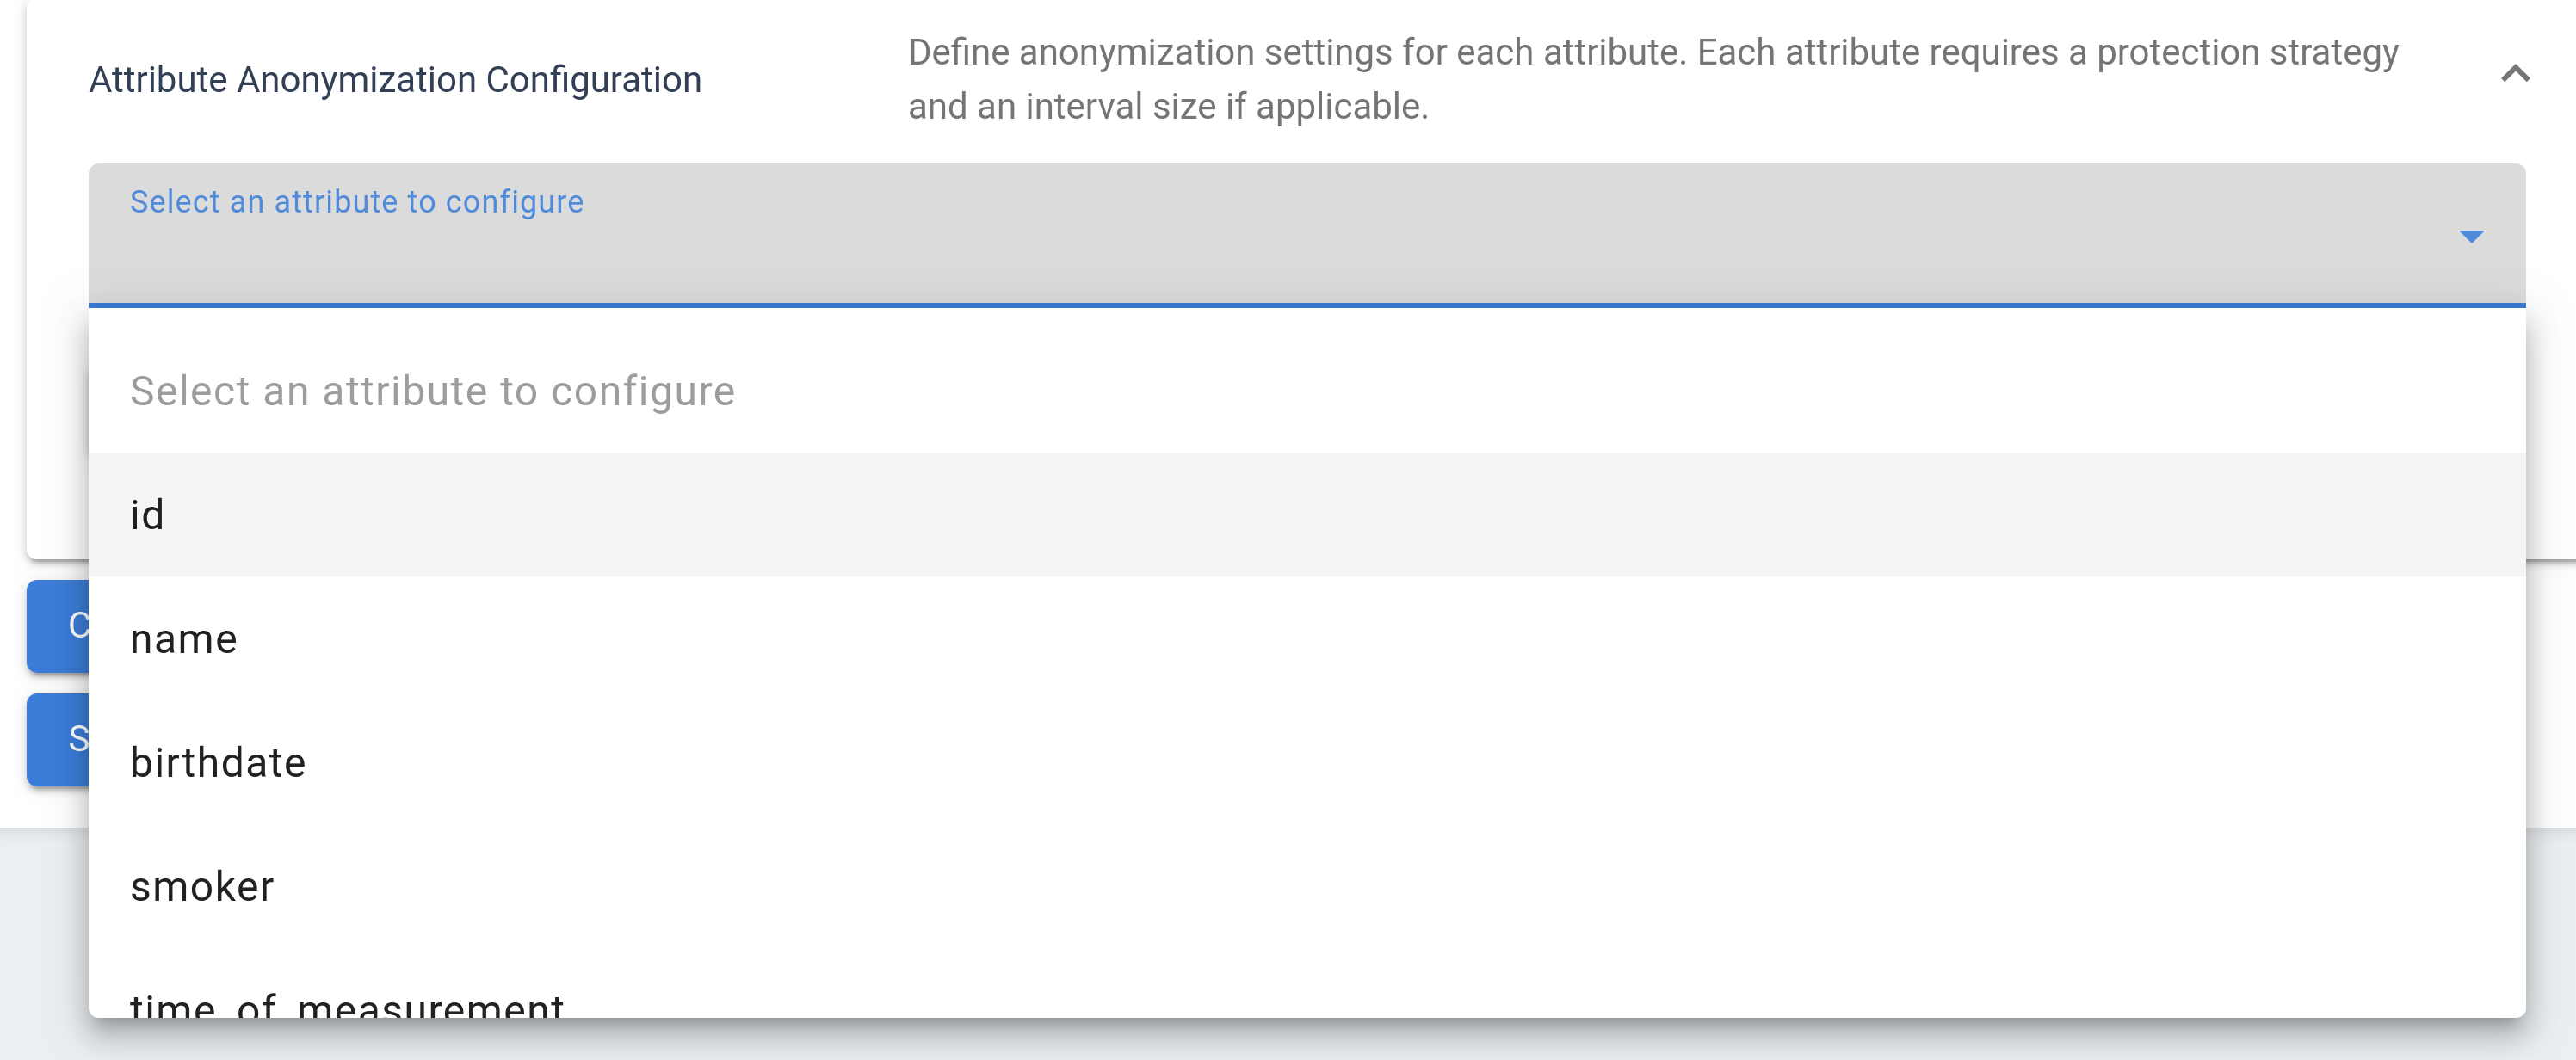
It’s crucial to configure protection settings for every attribute you wish to anonymize. If you do not define specific rules for an attribute, it will remain unchanged and will not be protected by the algorithm according to the defined privacy model. This structured approach grants you precise control over how each piece of your data is managed within the anonymization process.

If you do not want to perform any anonymization protection, you can skip this step with the  button.
Synthetization Configuration
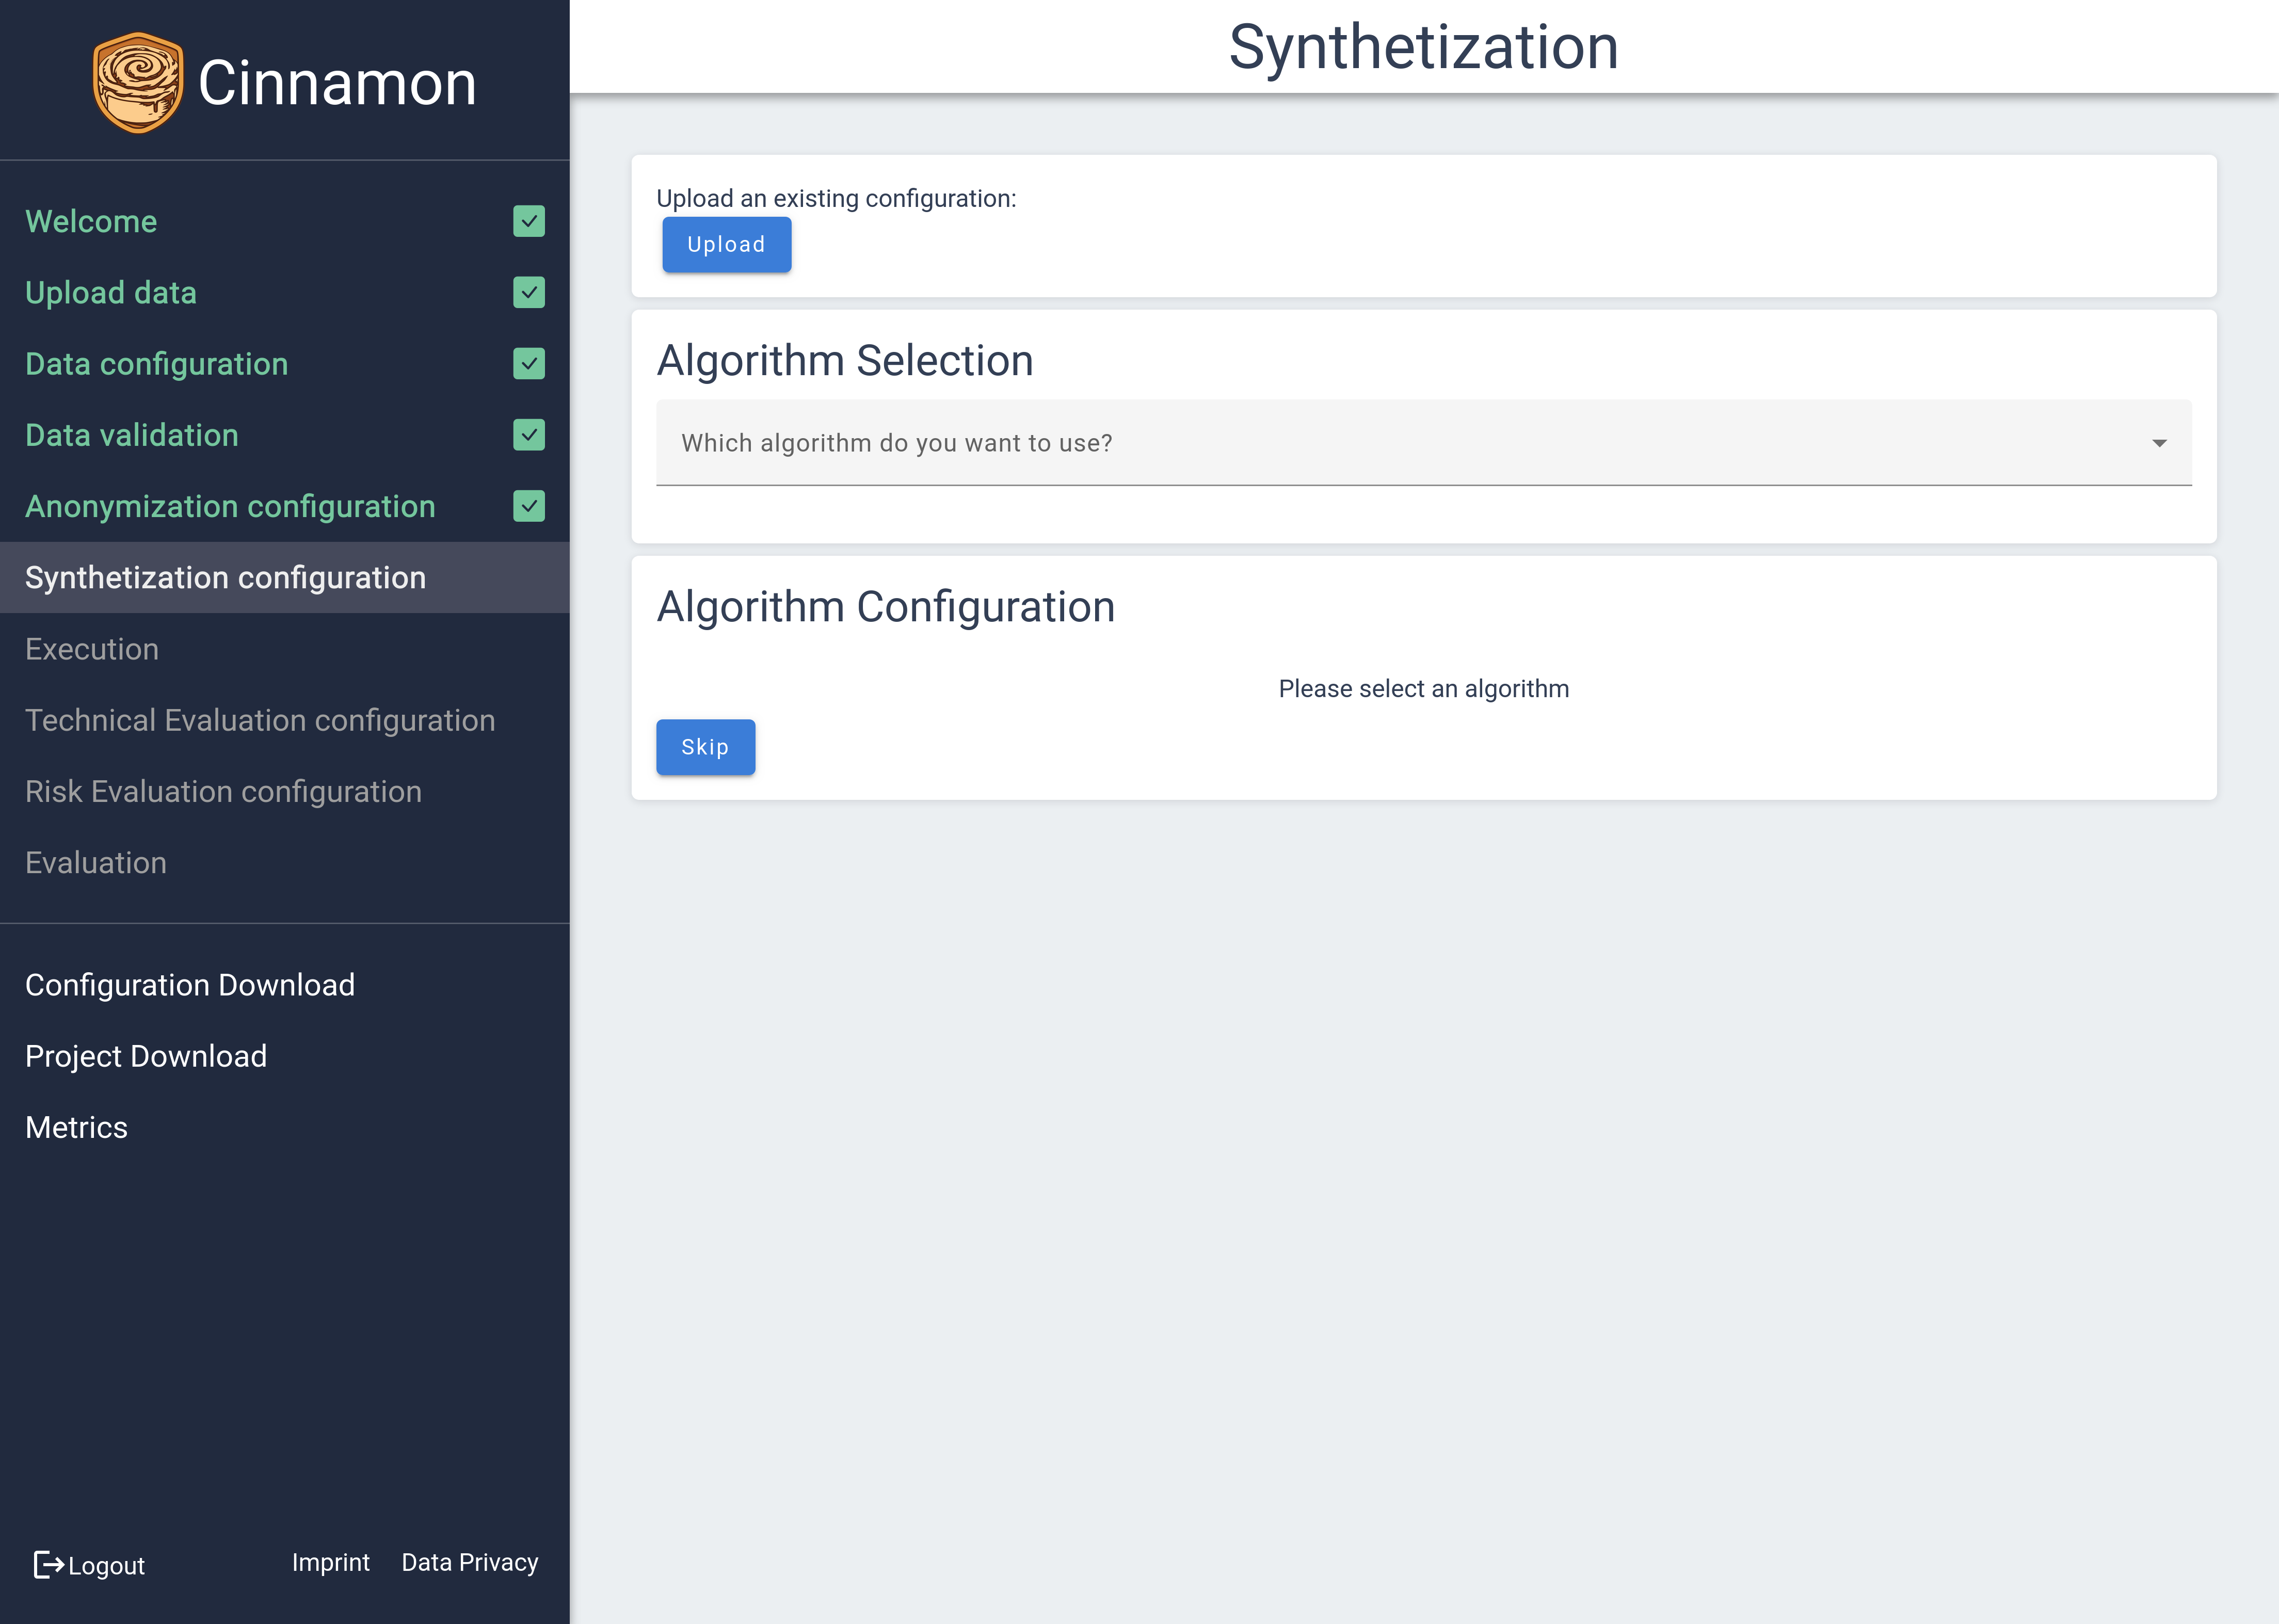 The Synthetization Configuration page is designed to let you select and fine-tune the synthetization methods that best suit your data needs. Initially, the page presents no preset configurations; you must first choose a synthetization method. Once a method is selected, relevant configuration options will be displayed, allowing you to customize your settings.
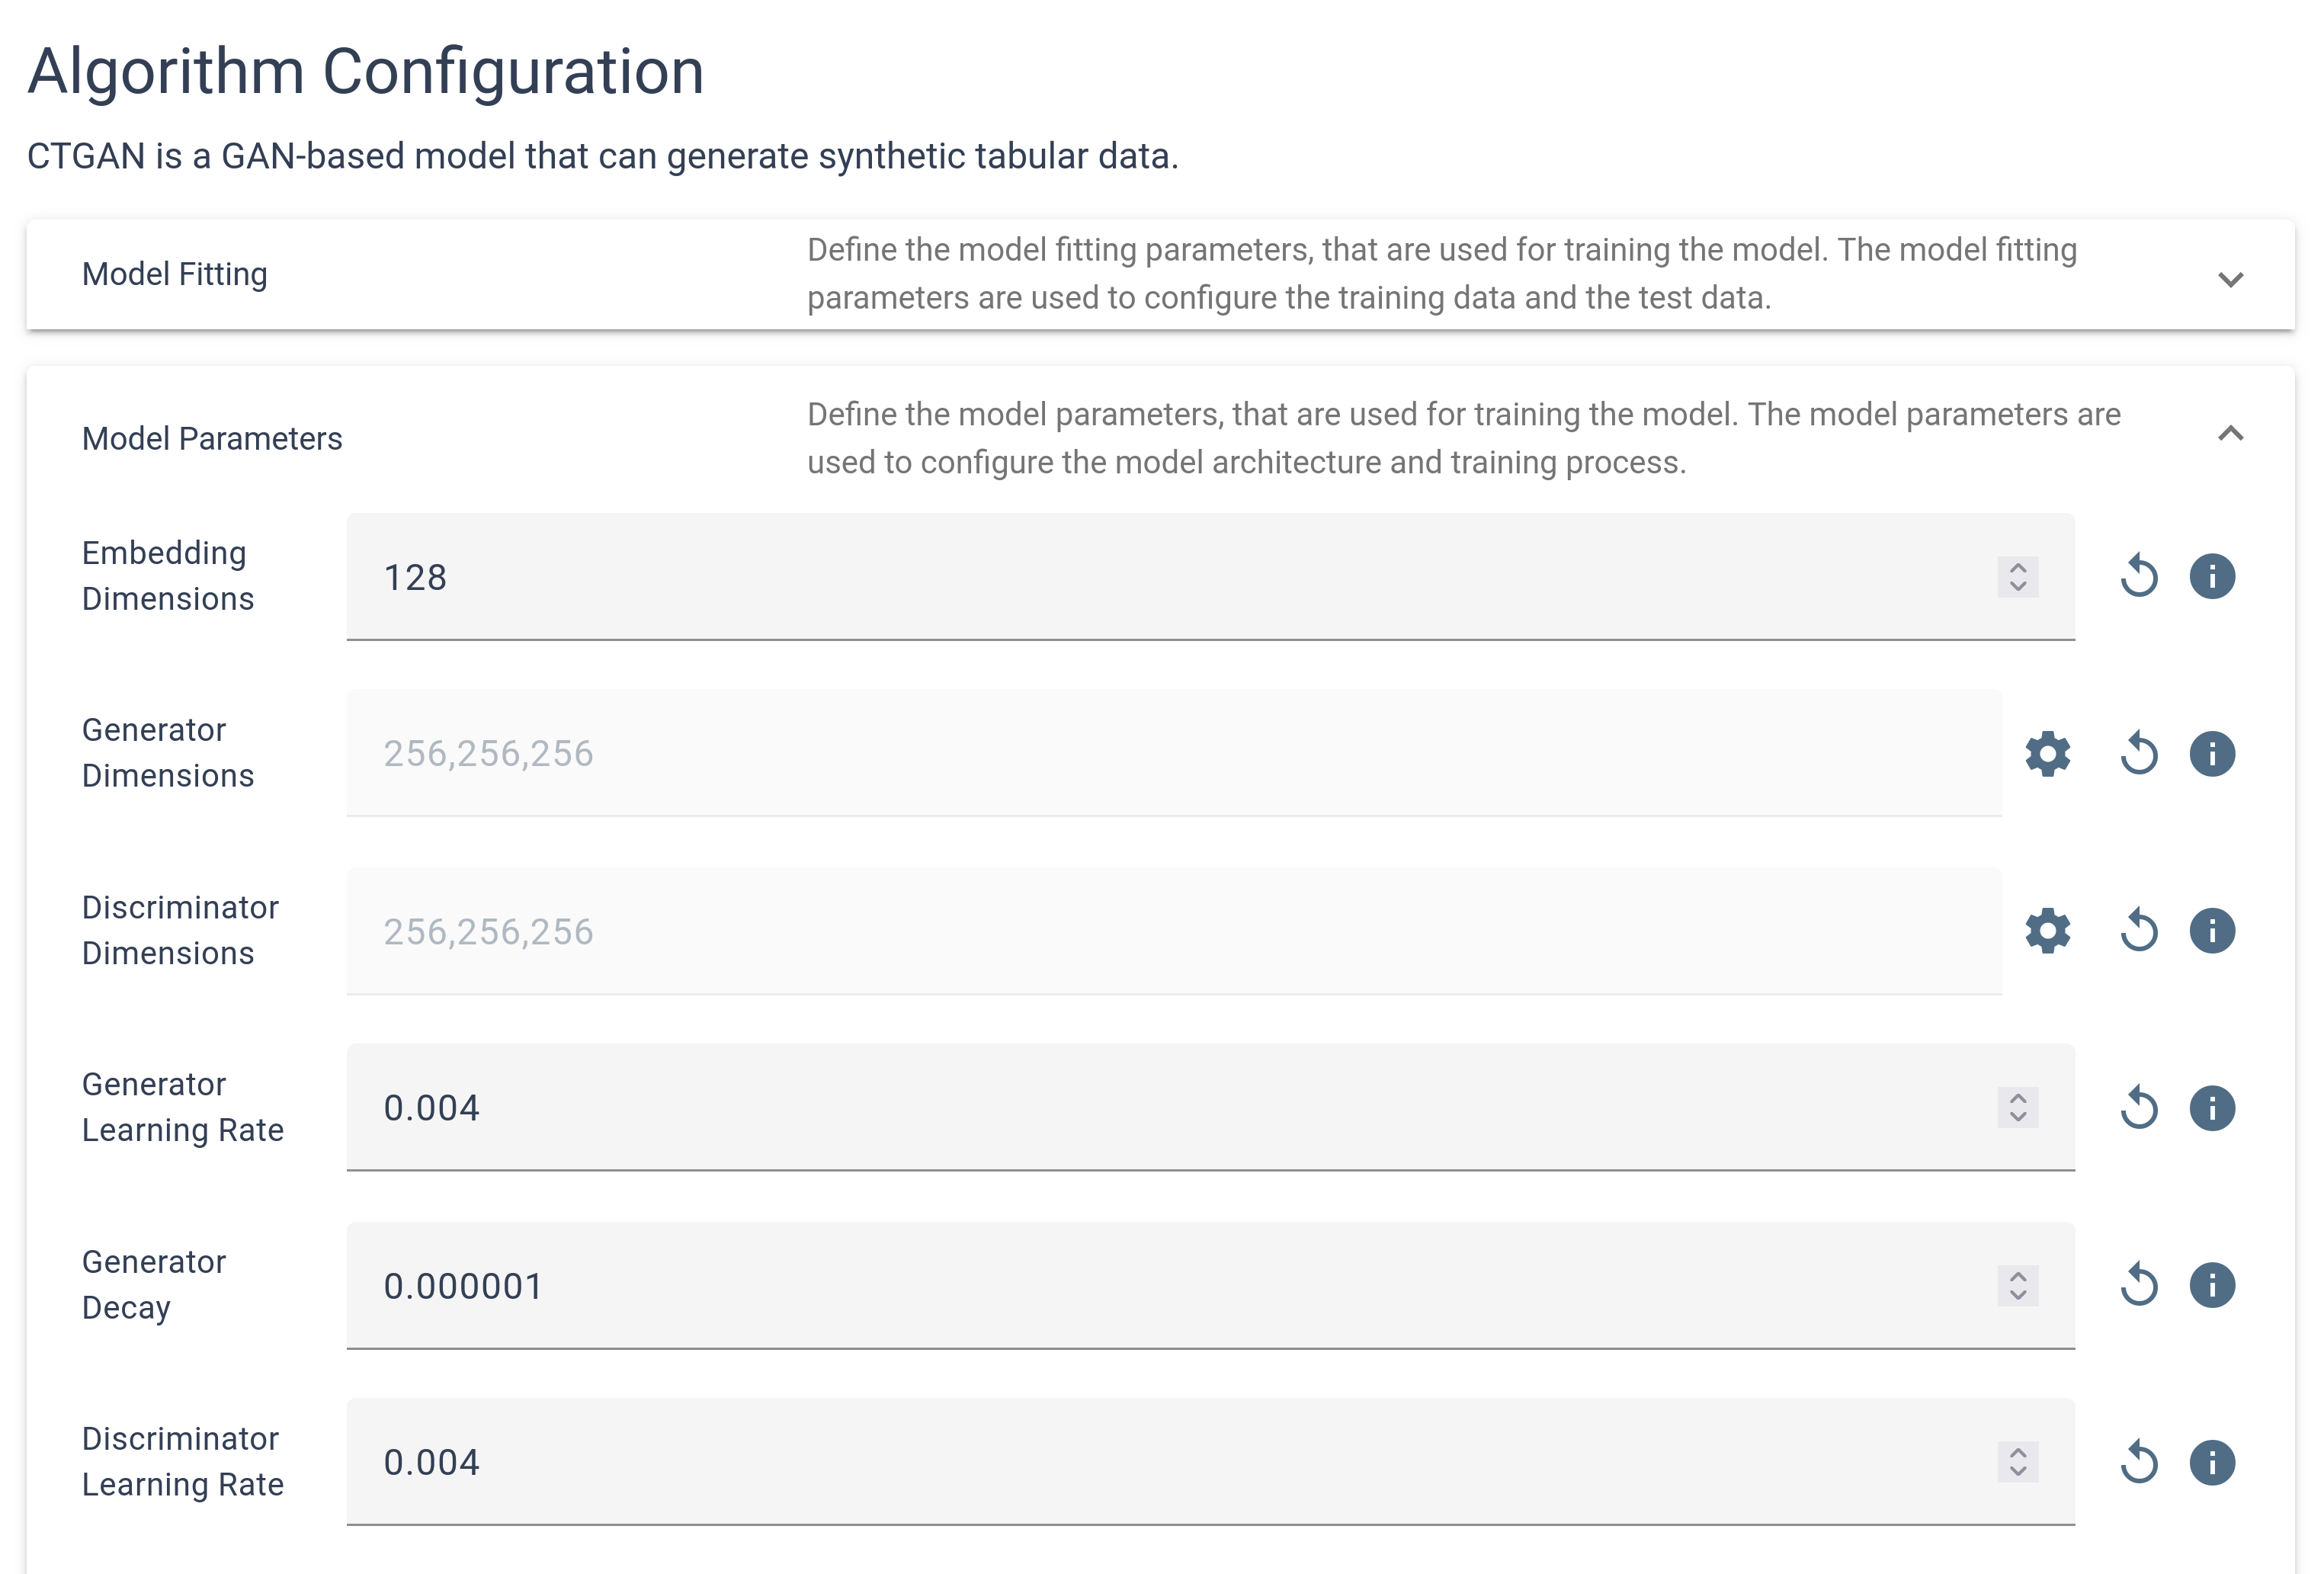 The configuration inputs can vary depending on the chosen method, providing a tailored setup process. These inputs may be organized into sub-configurations, each grouping related settings to simplify the configuration process and ensure clarity. This structured approach enables you to manage the synthetization settings effectively, facilitating a smooth and personalized experience tailored to your specific data synthesis requirements.
Execution
The Execution Page is your command center for managing and monitoring the status of your current pipeline. Here, the steps you configured previously are initiated, with processes executed in sequence—starting with anonymization, followed by synthetization.
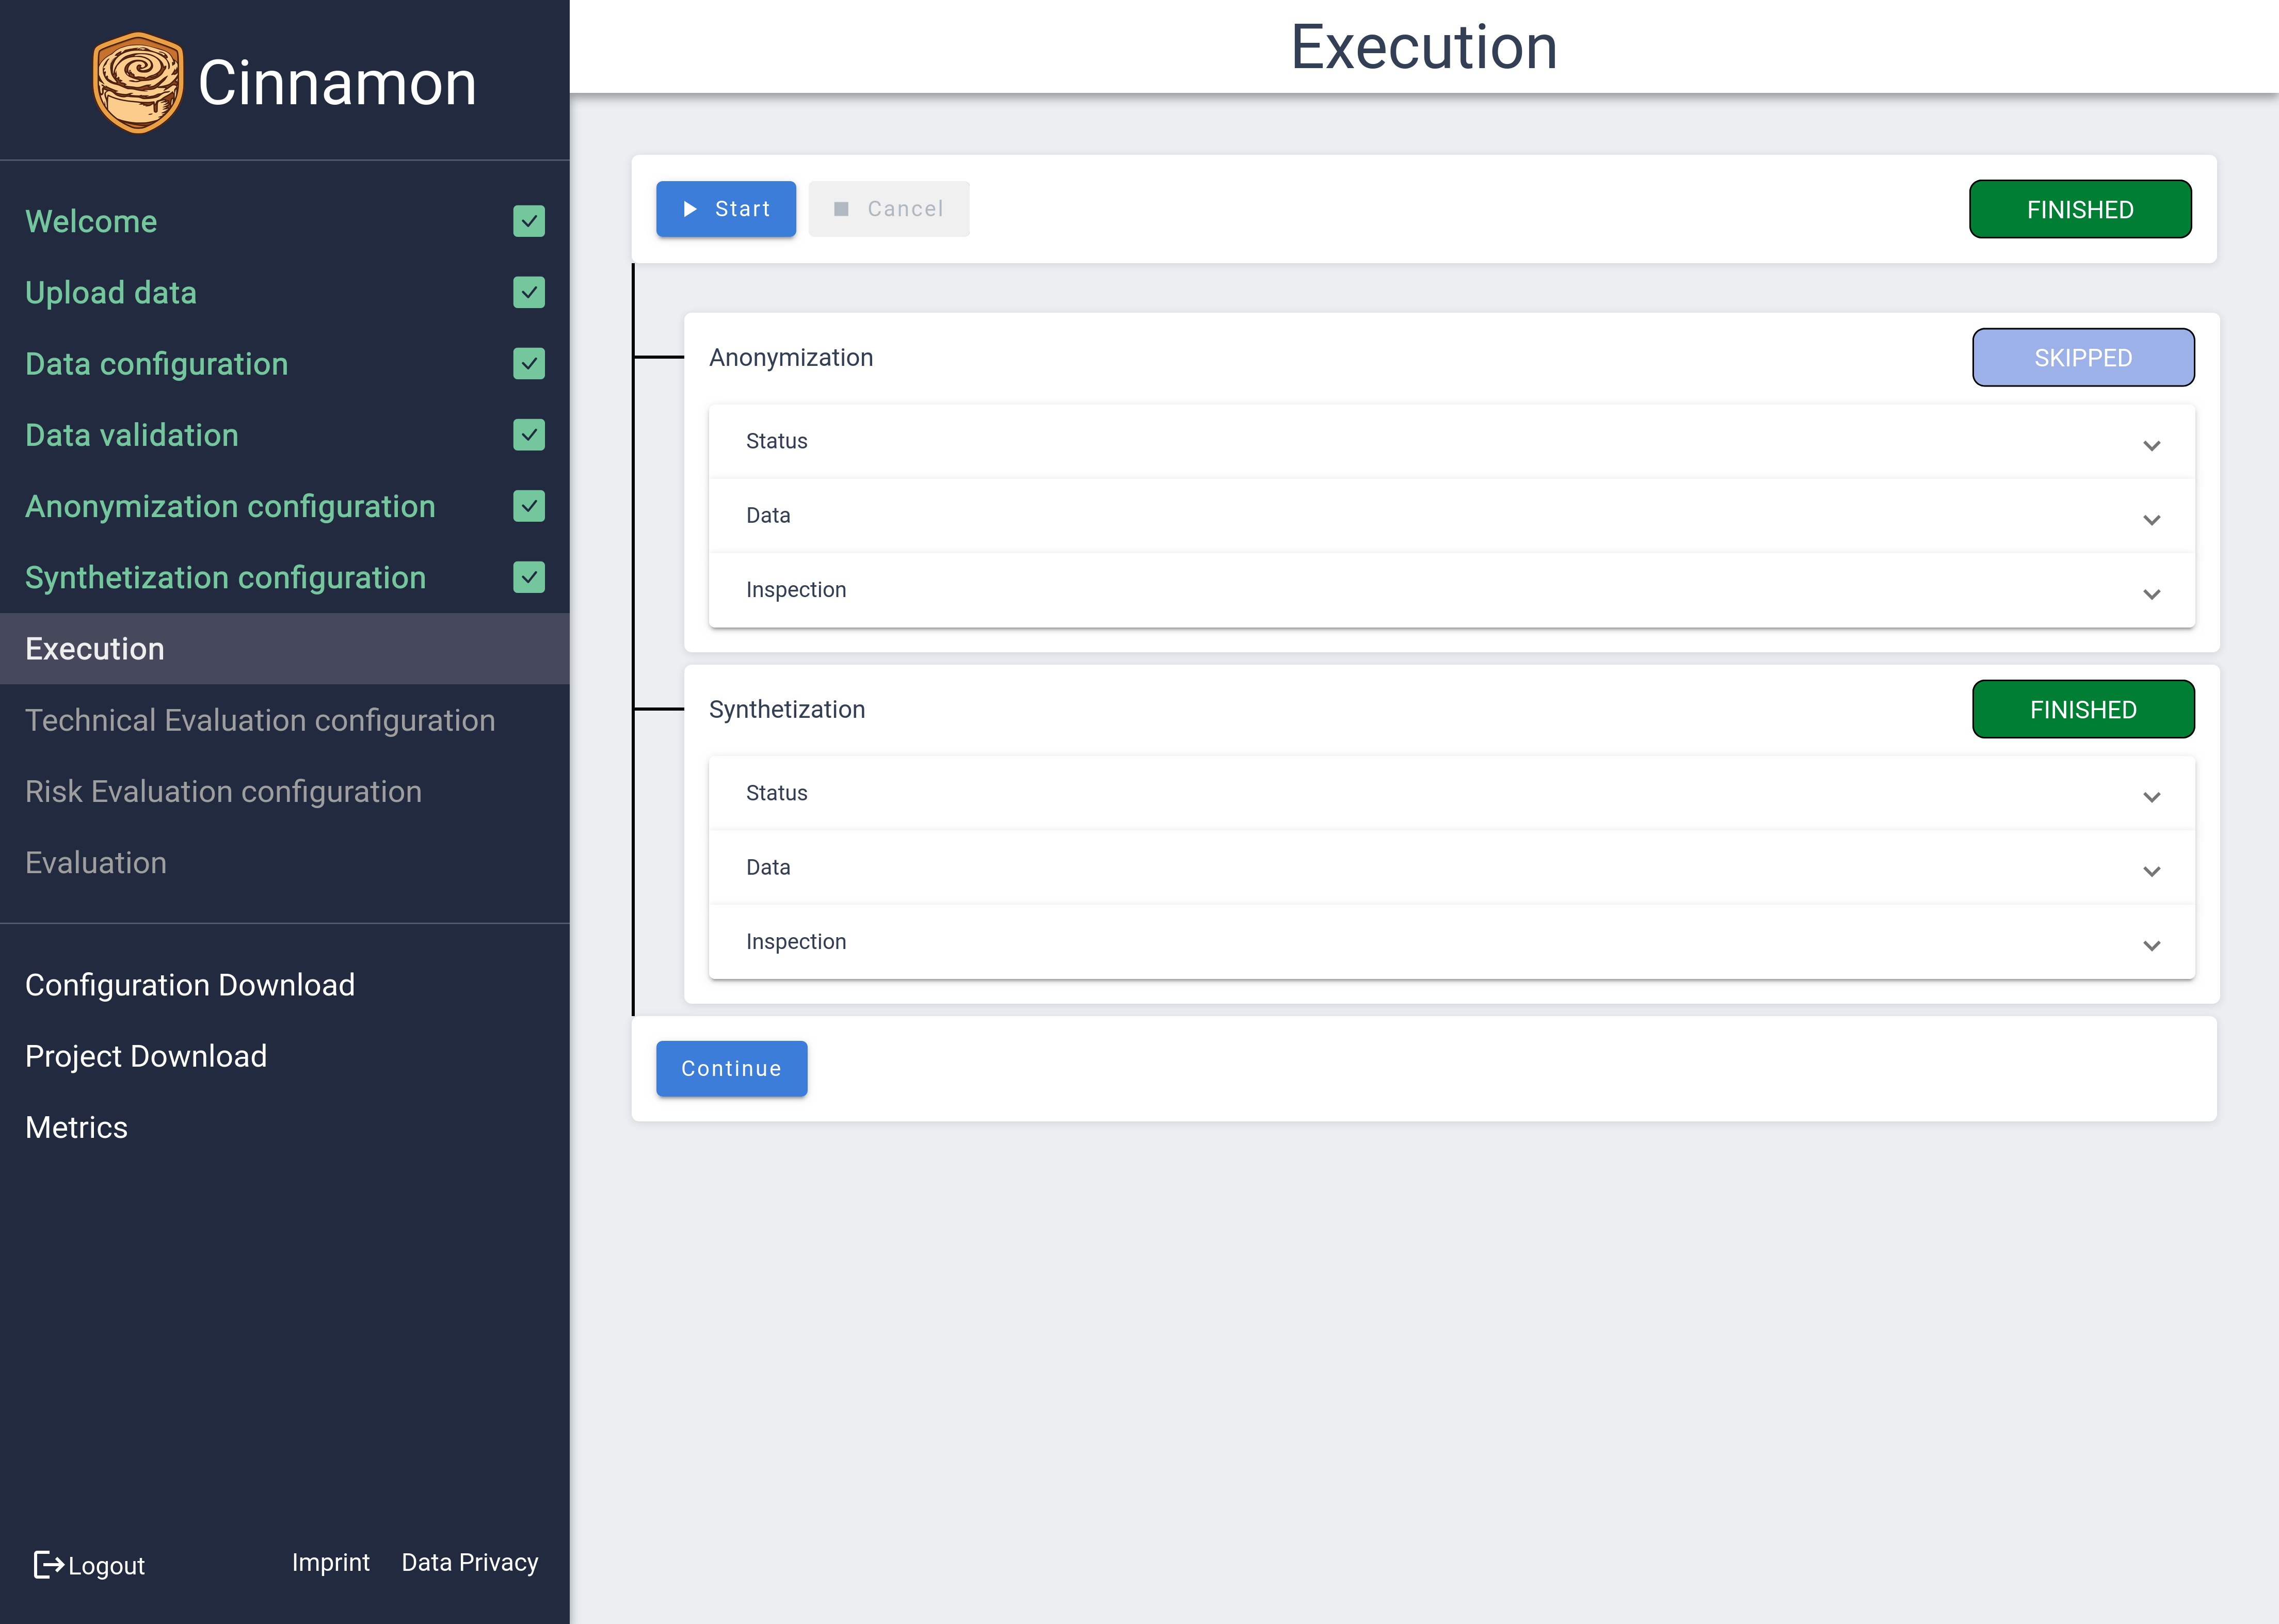
Throughout the processing pipeline, you can view the status of each step as it changes from not started ( ) to running (
 ), and finally to finished (
 ). Skipped steps will be shown as well (
 ).
).
While a step is running, the status tab provides real-time updates and estimates on remaining processing time, keeping you informed of progress.
Once a step is completed, you can inspect the processed data by accessing the table view and attribute statistics, much like in the Validation view. This feature allows you to review the outcomes of each processing step thoroughly, ensuring the results meet your expectations before moving forward.
Technical Evaluation
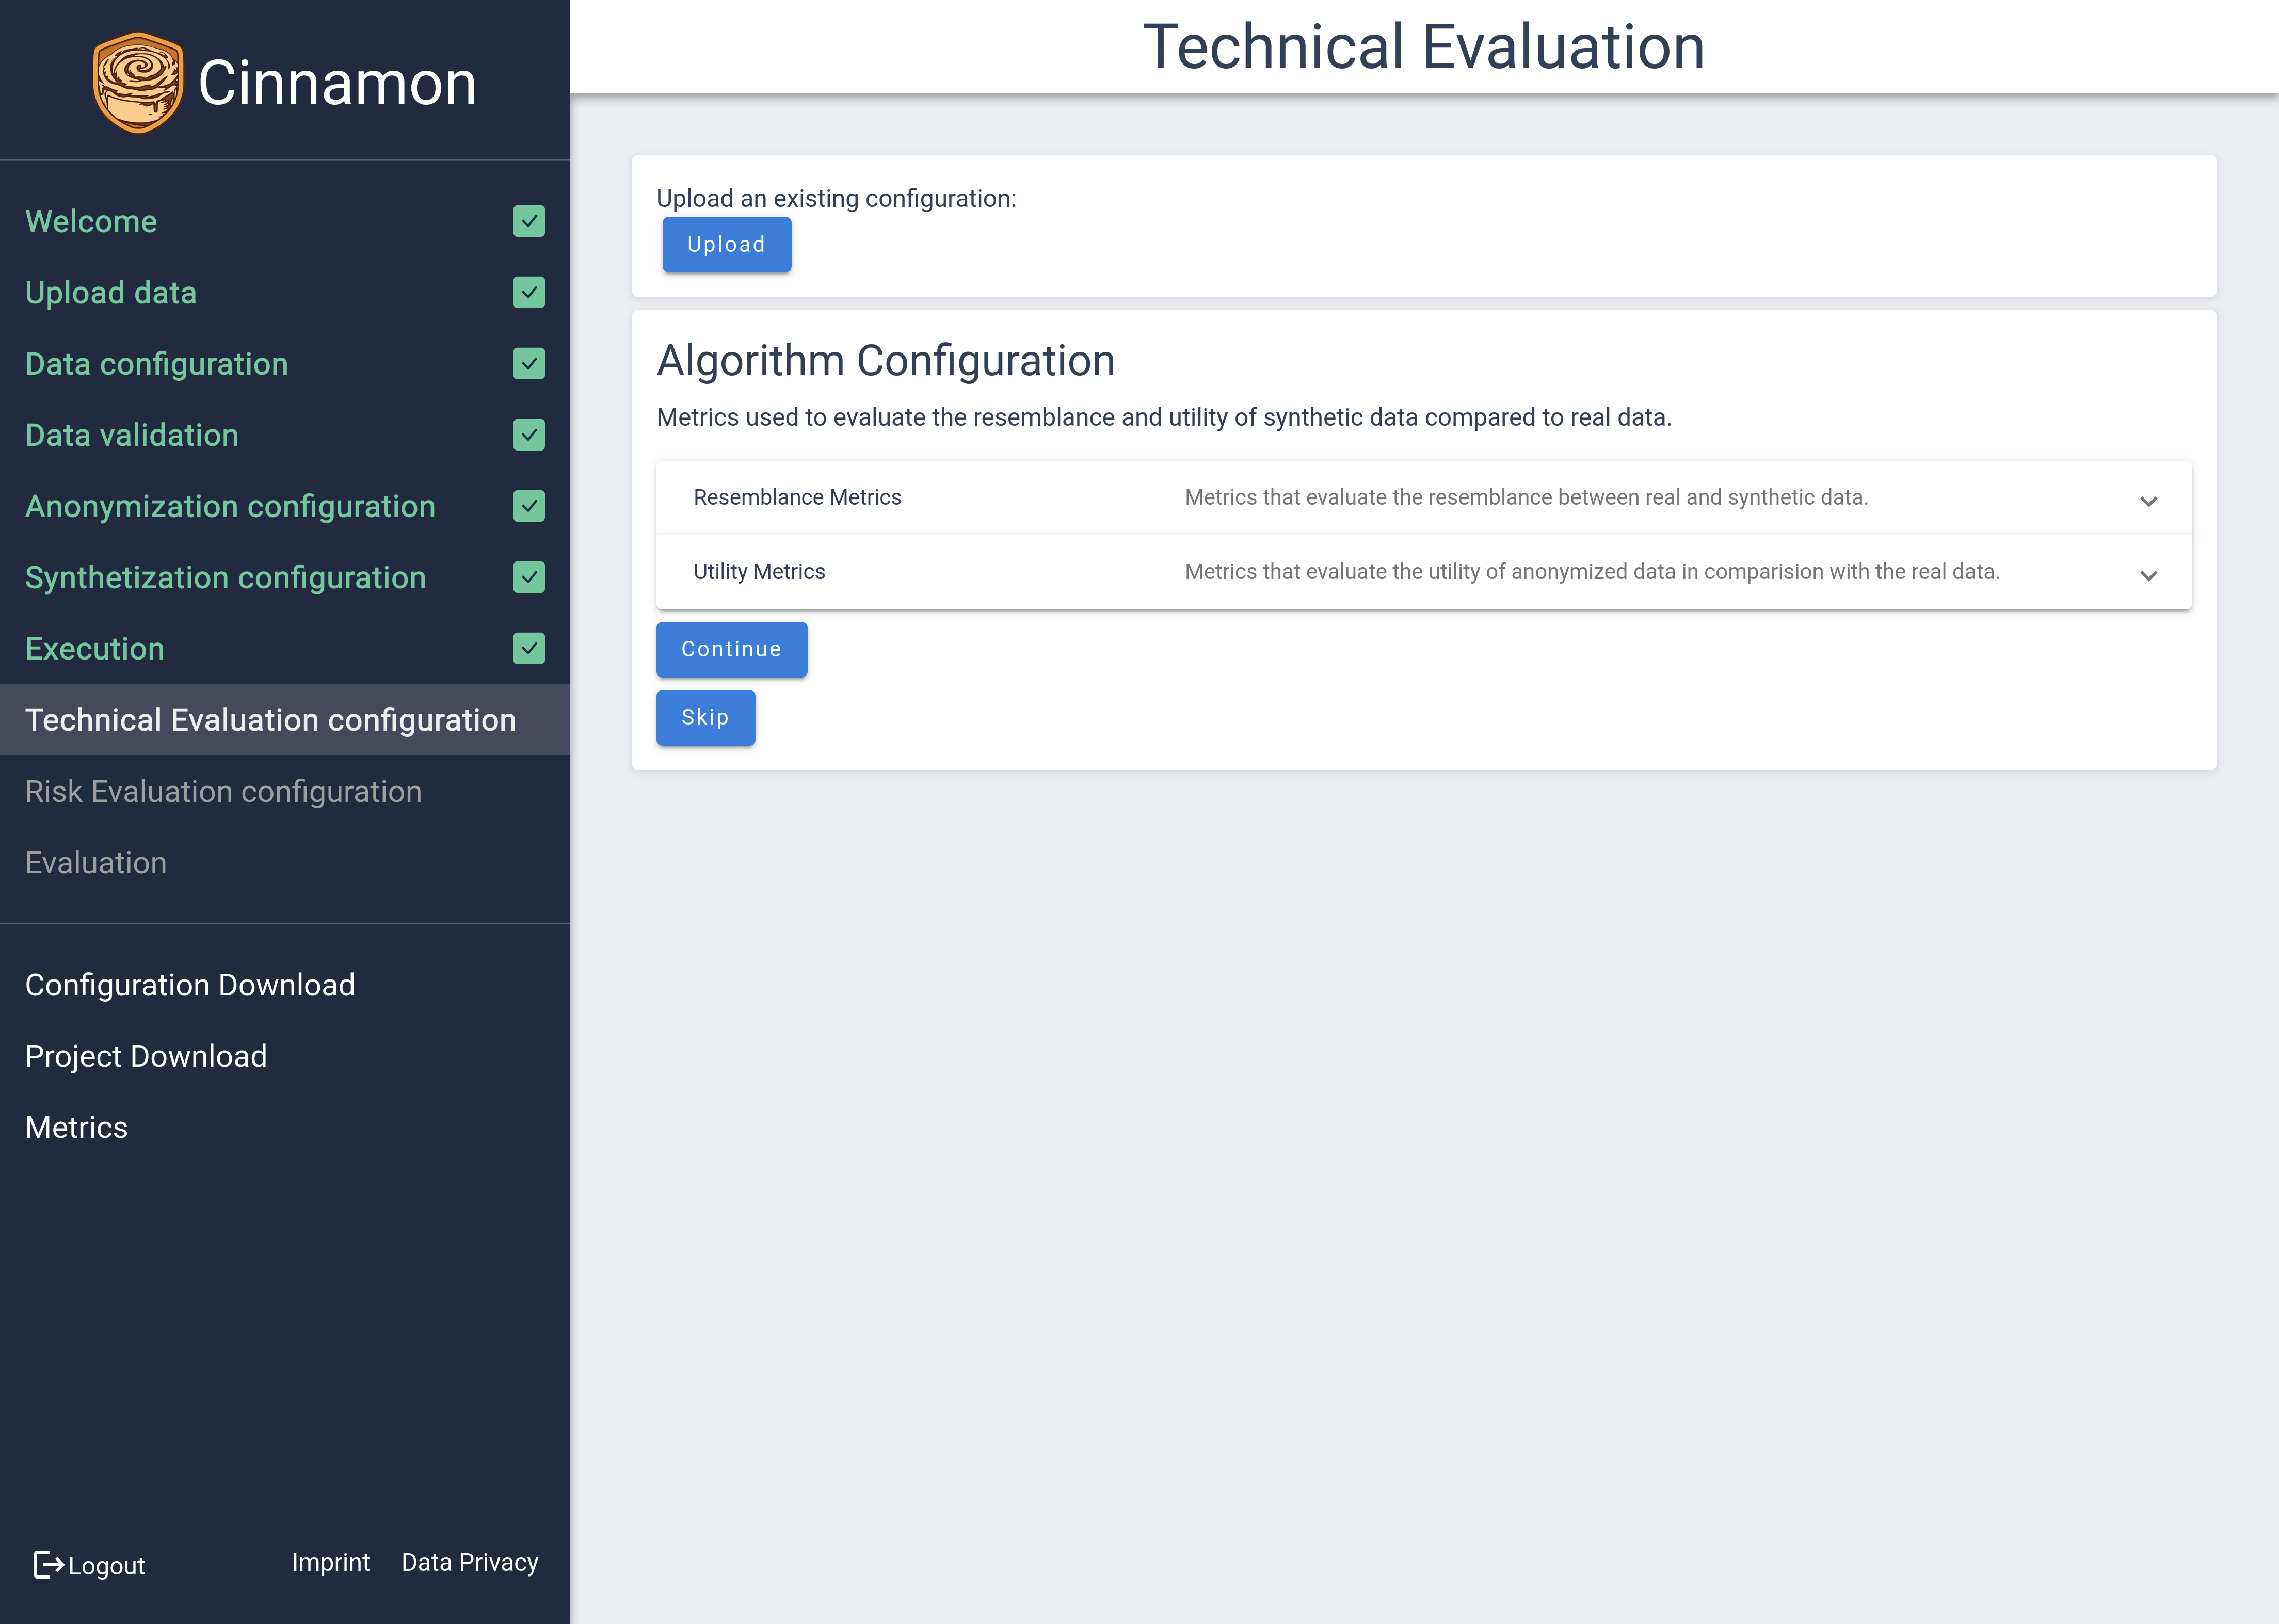 The Technical Evaluation module operates similarly to the anonymization and synthetization configurations by registering configuration options tailored to specific evaluation needs. However, it differs from algorithmic configurations mainly in its focus on enabling or disabling specific metric calculations, allowing you to customize which aspects of evaluation are prioritized.
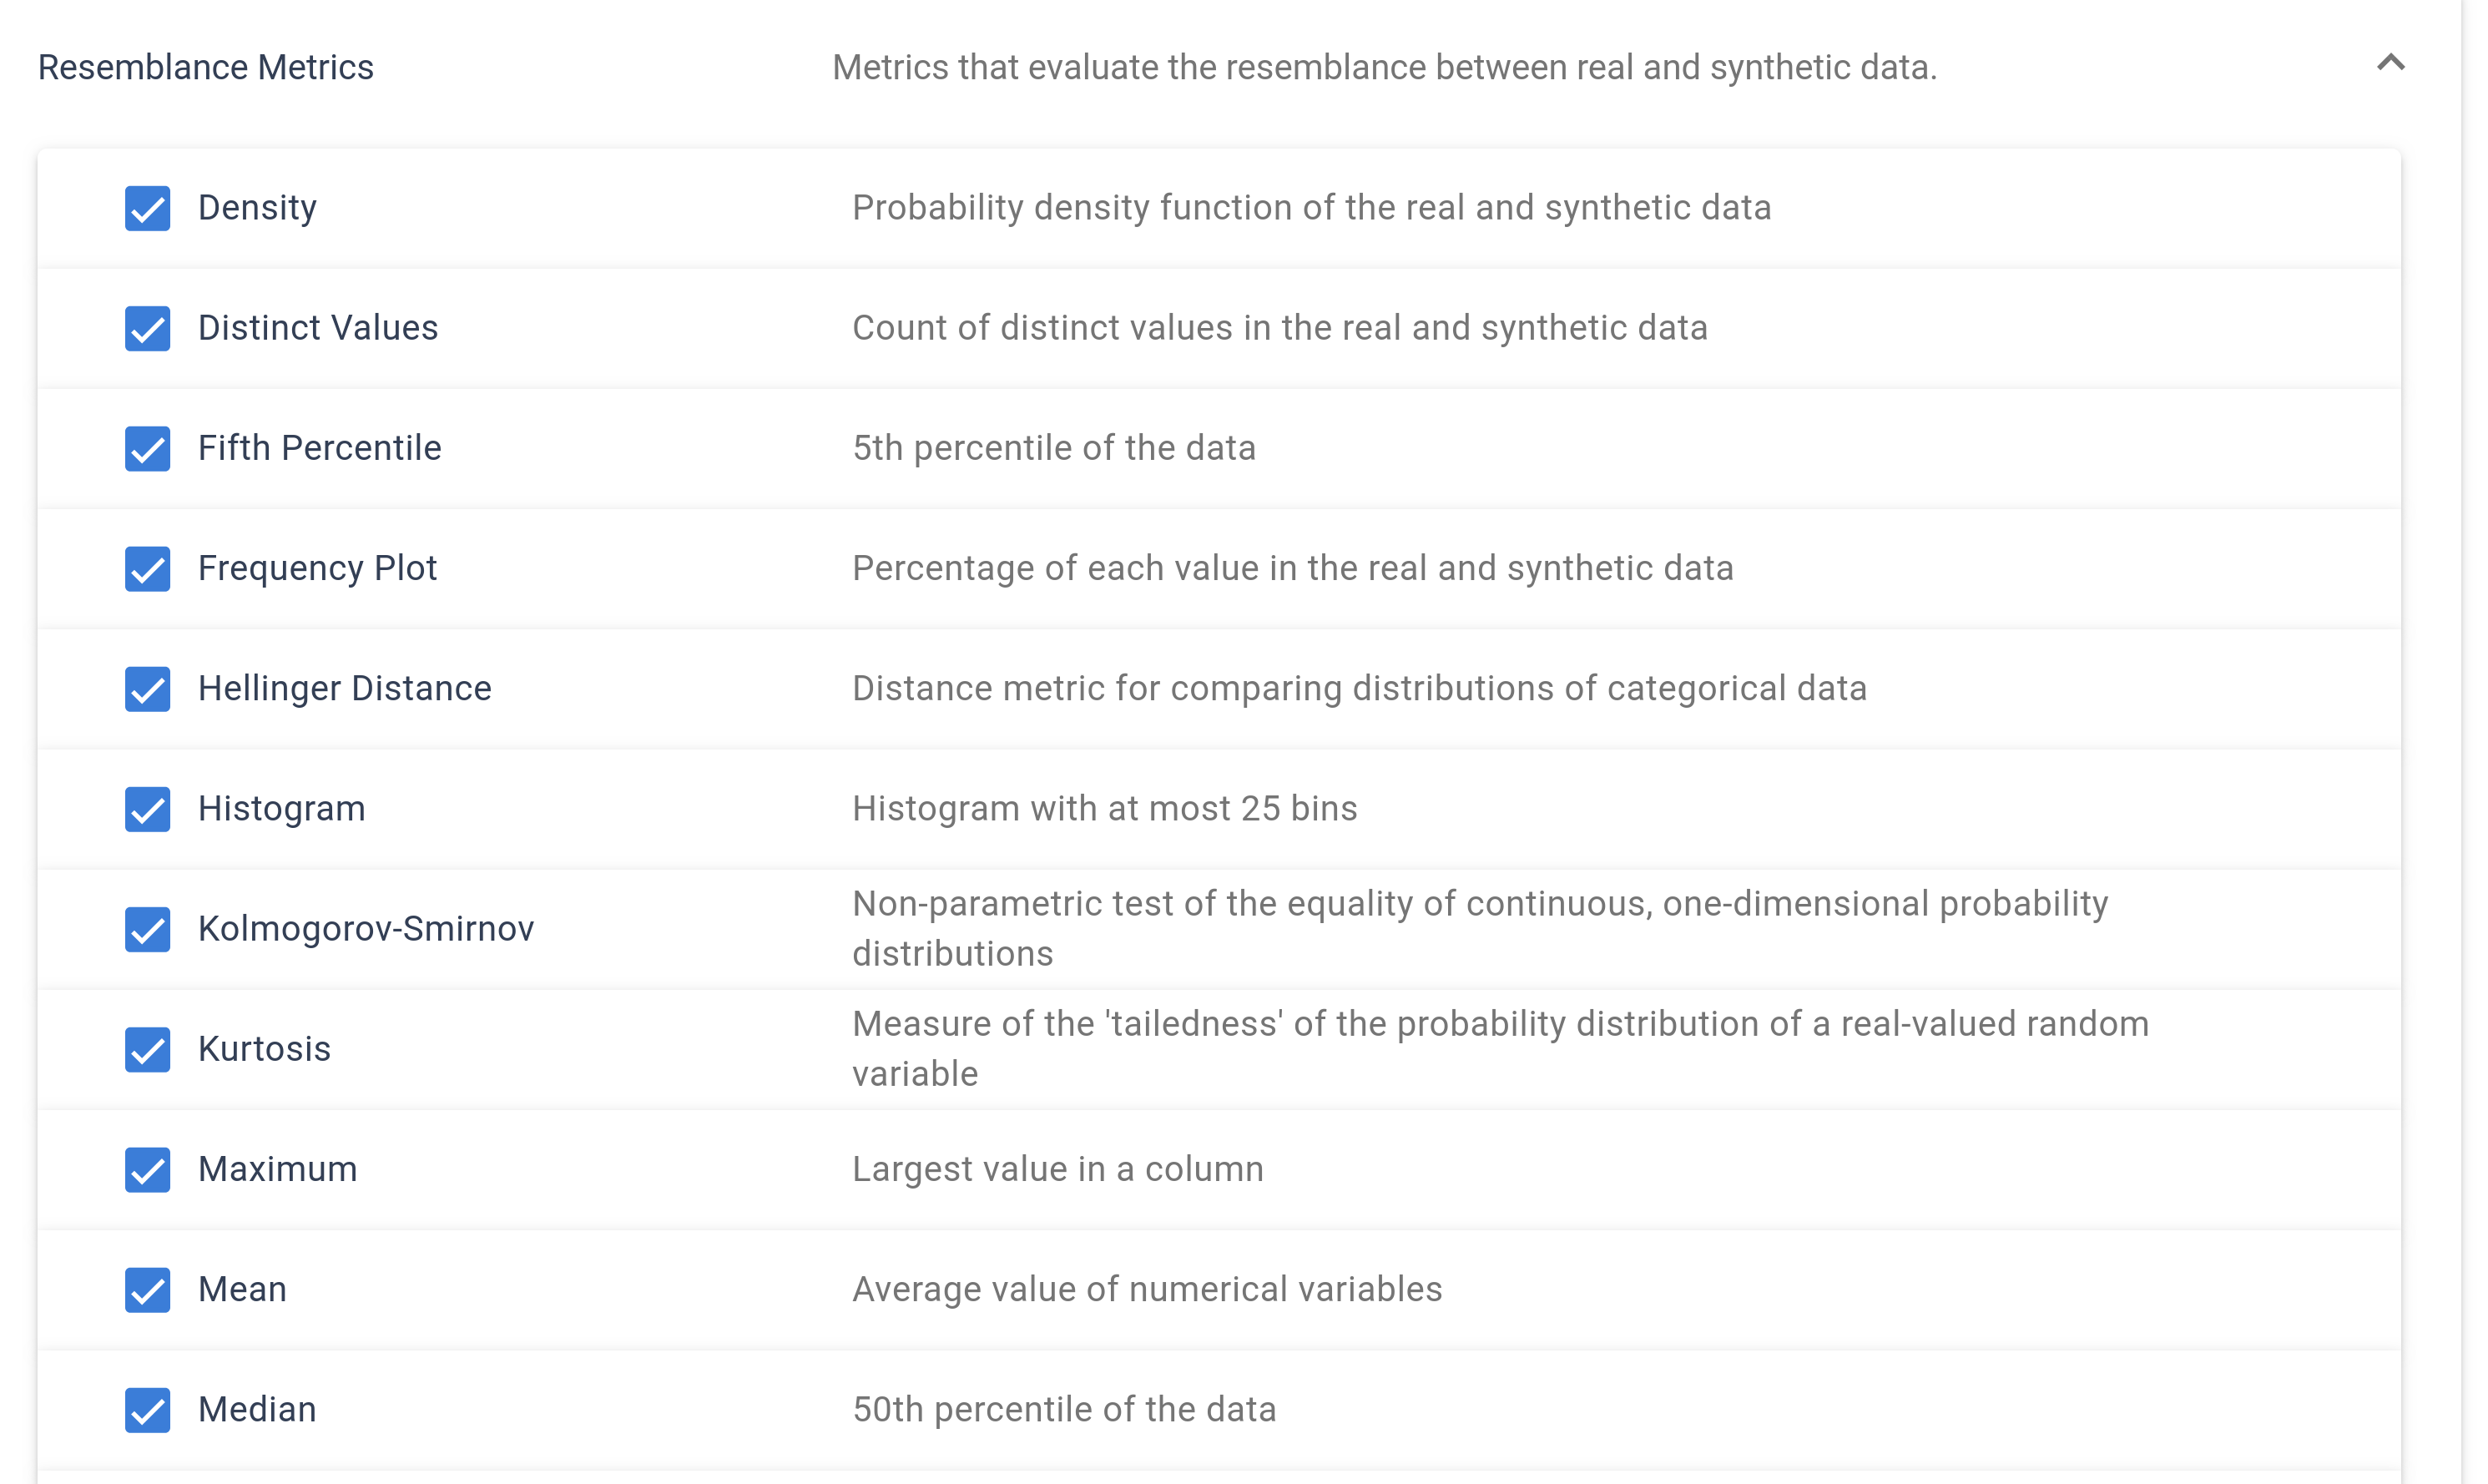
Within this module, you can configure both resemblance metrics and utility metrics. Resemblance metrics assess how closely the processed data mirrors the original dataset, while utility metrics focus on evaluating the potential performance of AI models trained on the data for a specified target variable. This setup provides a comprehensive evaluation framework to ensure that data maintains its integrity and usefulness post-processing.
Risk Evaluation
The Risk Evaluation module is designed to assess the vulnerability of your data by simulating various attack scenarios. It systematically performs attempts at information inference, record linkage, and the singling out of individual records to identify potential privacy risks.
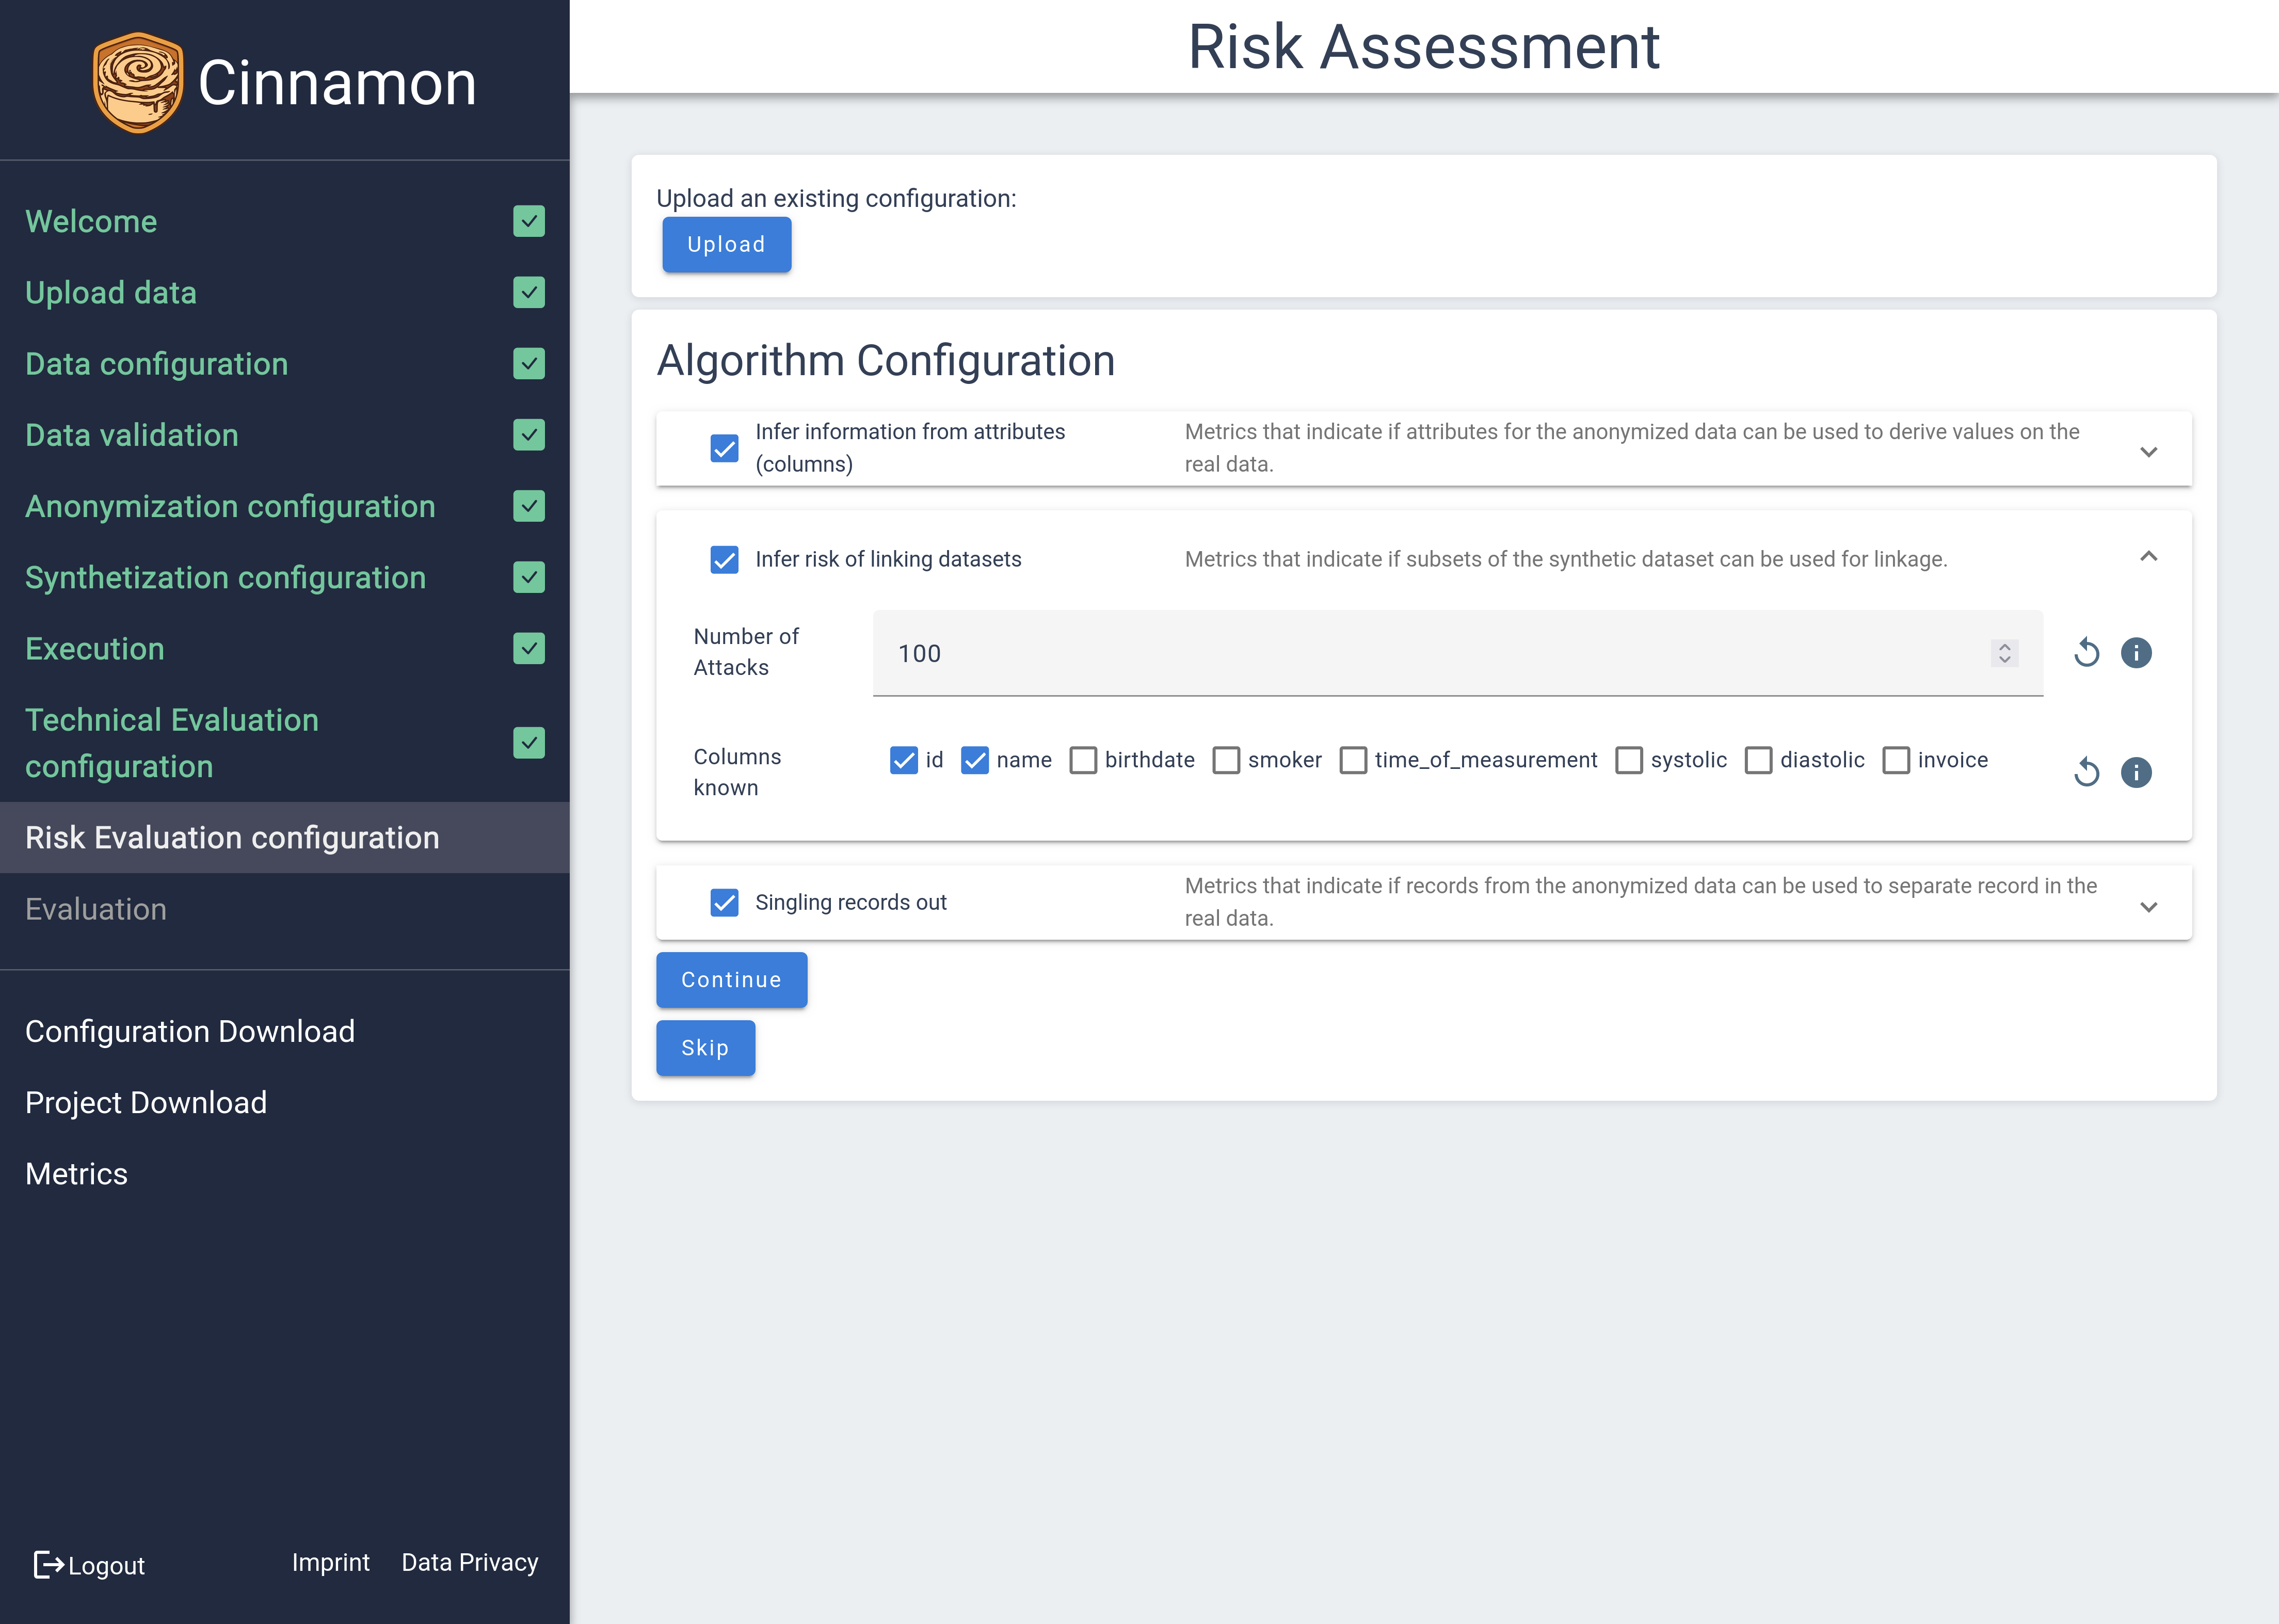
Information inference tests whether sensitive information can be indirectly discovered from the data. Record linkage evaluates the possibility of matching anonymized records with external datasets to identify individuals. Singling out assesses the risk that individual records can be uniquely identified within the dataset.
This comprehensive risk assessment ensures that your data maintains a high standard of privacy and security, helping identify and mitigate potential threats before they become issues.
Analyzing Results
The Evaluation Results page provides results for the evaluation process for the protected data. The page is structured similarly to the functionality of the execution page. This page is divided into two main sections: one for the Technical Evaluation and another for the Risk Evaluation, each offering distinct insights into different aspects of your data’s protection level.
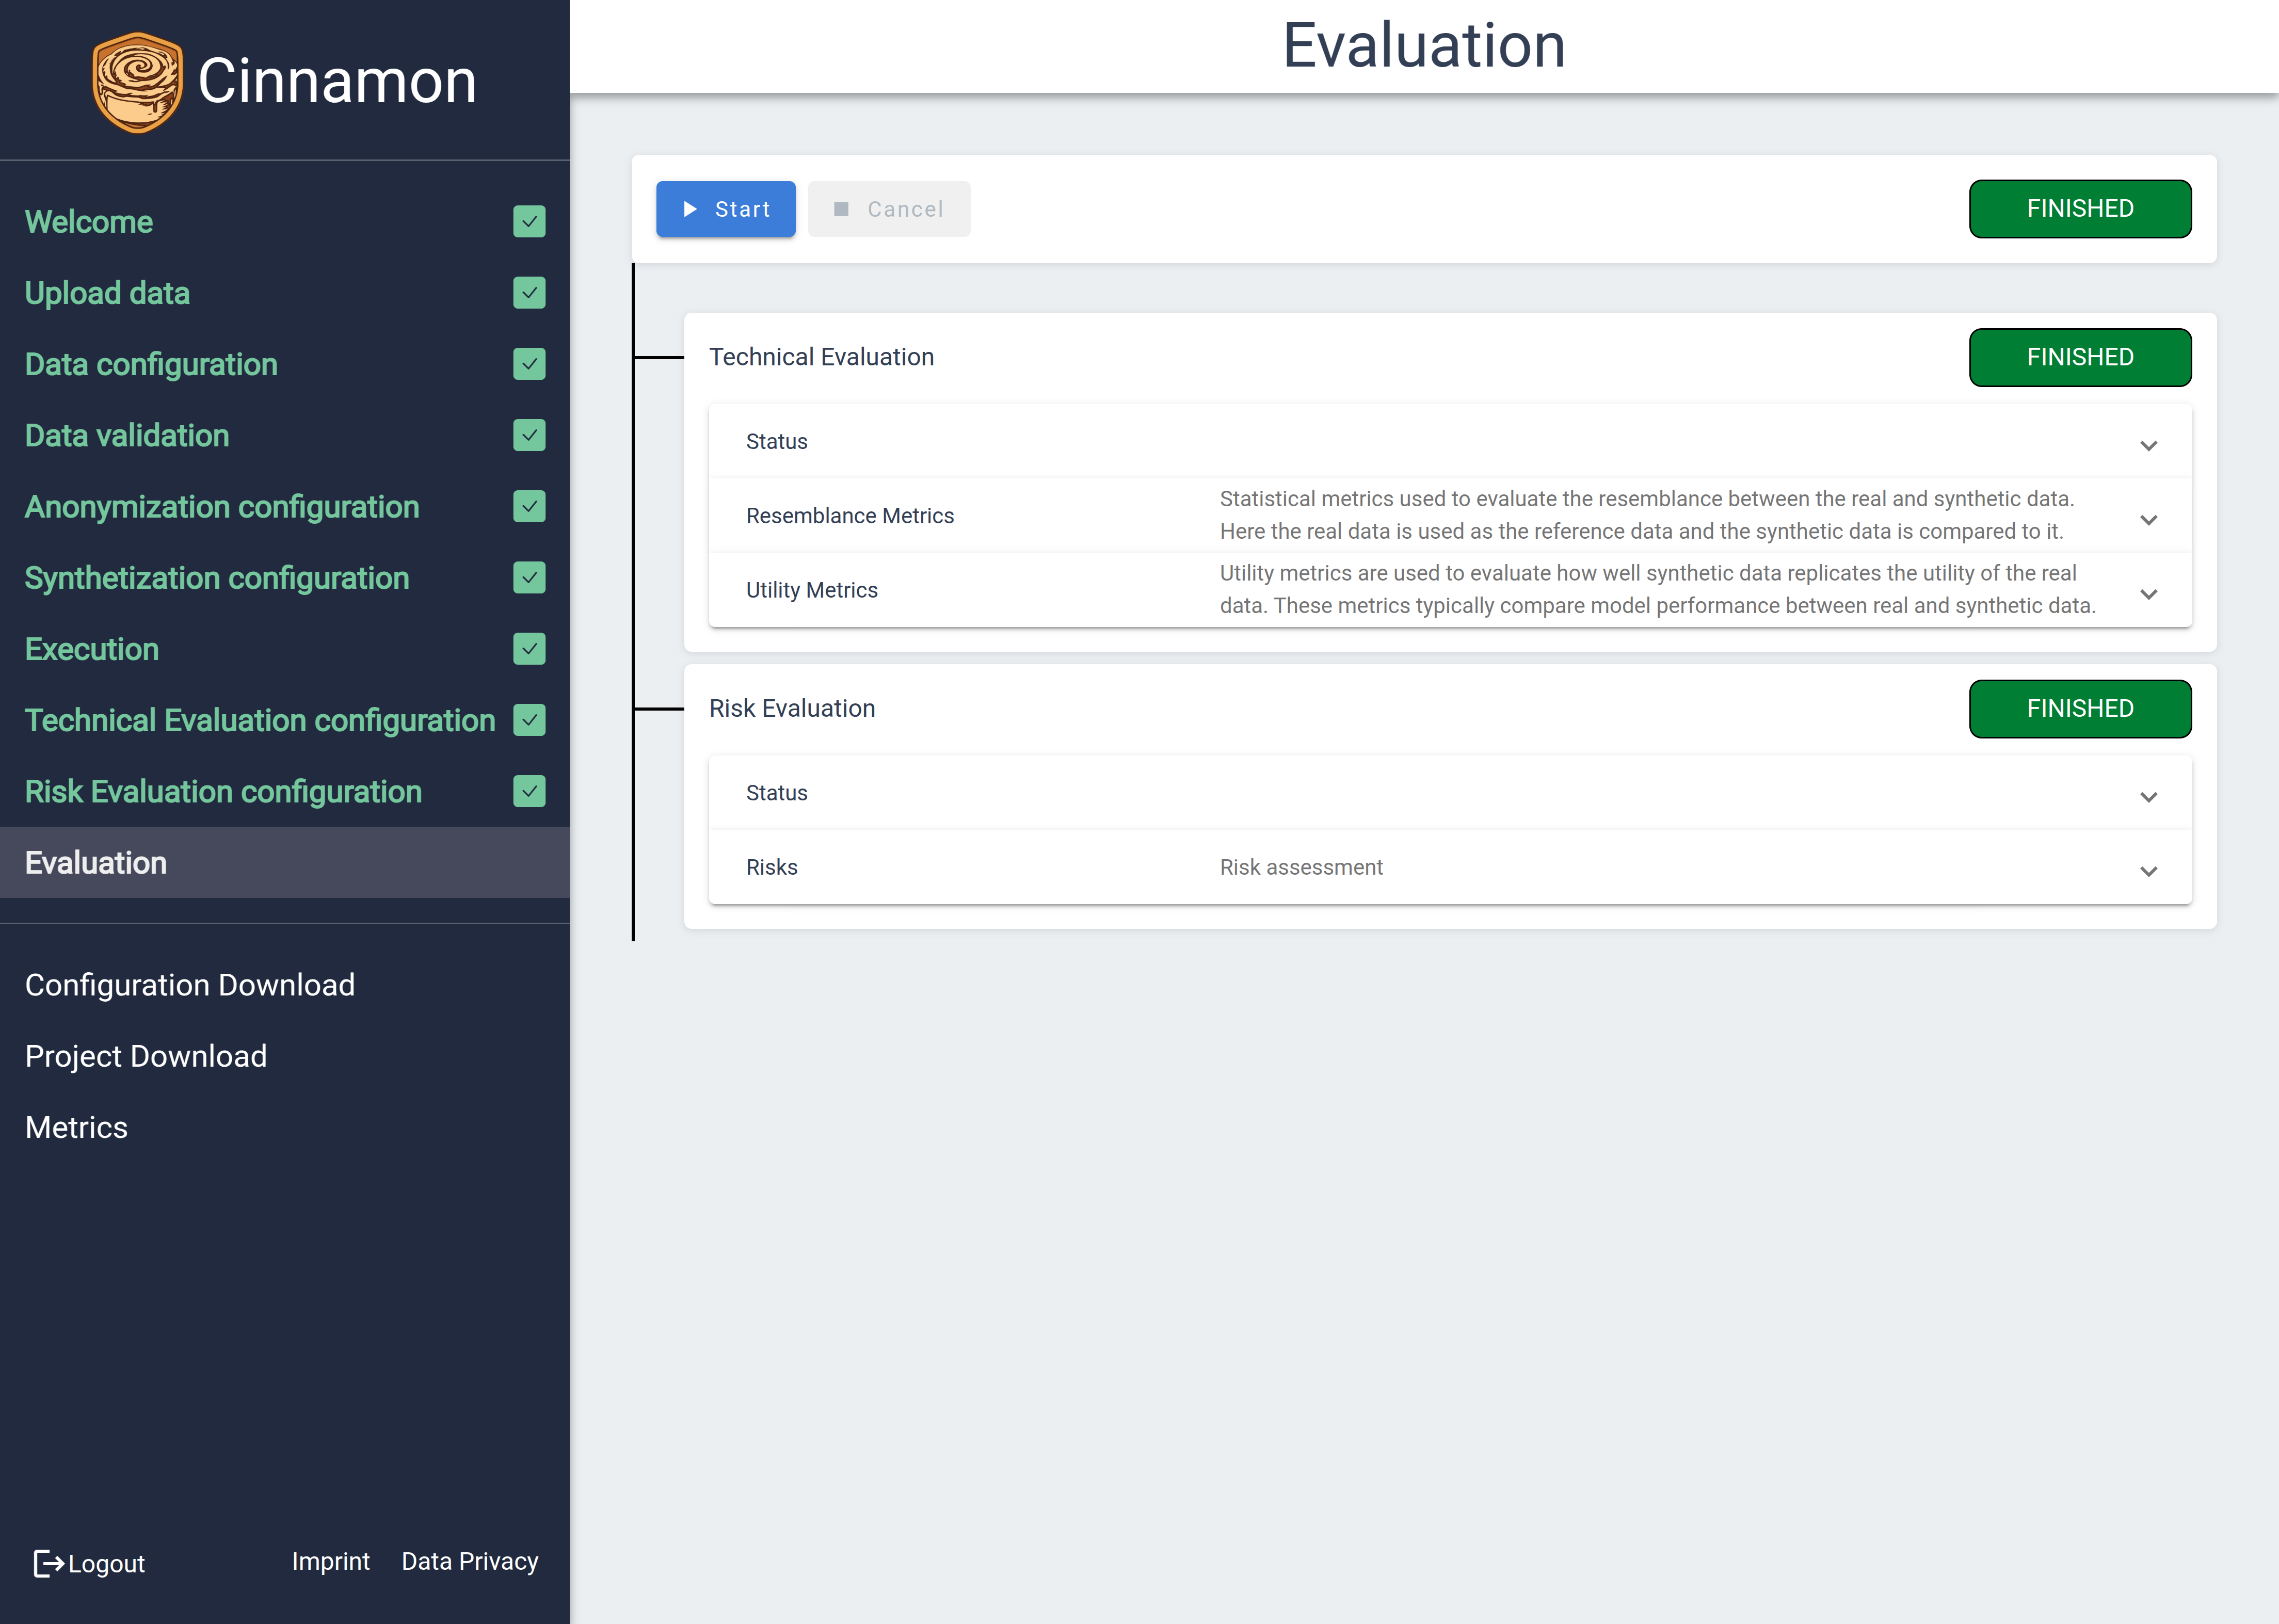 The following sections give a deeper explanation about the Technical and Risk Evaluation.
Technical Evaluation
Resemblance Metrics:
Similar to the statistical attribute inspection, the resemblance is presented in two different views.
A simple overview giving statistical information about the protected data and a detailed overview for a deeper analysis of the resemblance.
The simplified overview is the same as in the statistical attribute inspection except that the graph now shows the distribution of the protected data and the original data.
The detailed view is divided into multiple sections.
❶
Indicator for the attribute for which details are shown.
❷
Overview of the settings for the attribute
❸
Comparison for important metrics.
❹ Comparison for distributions
❺ Tables comparing the values of the attribute.
❻ Comparison of additional metrics.
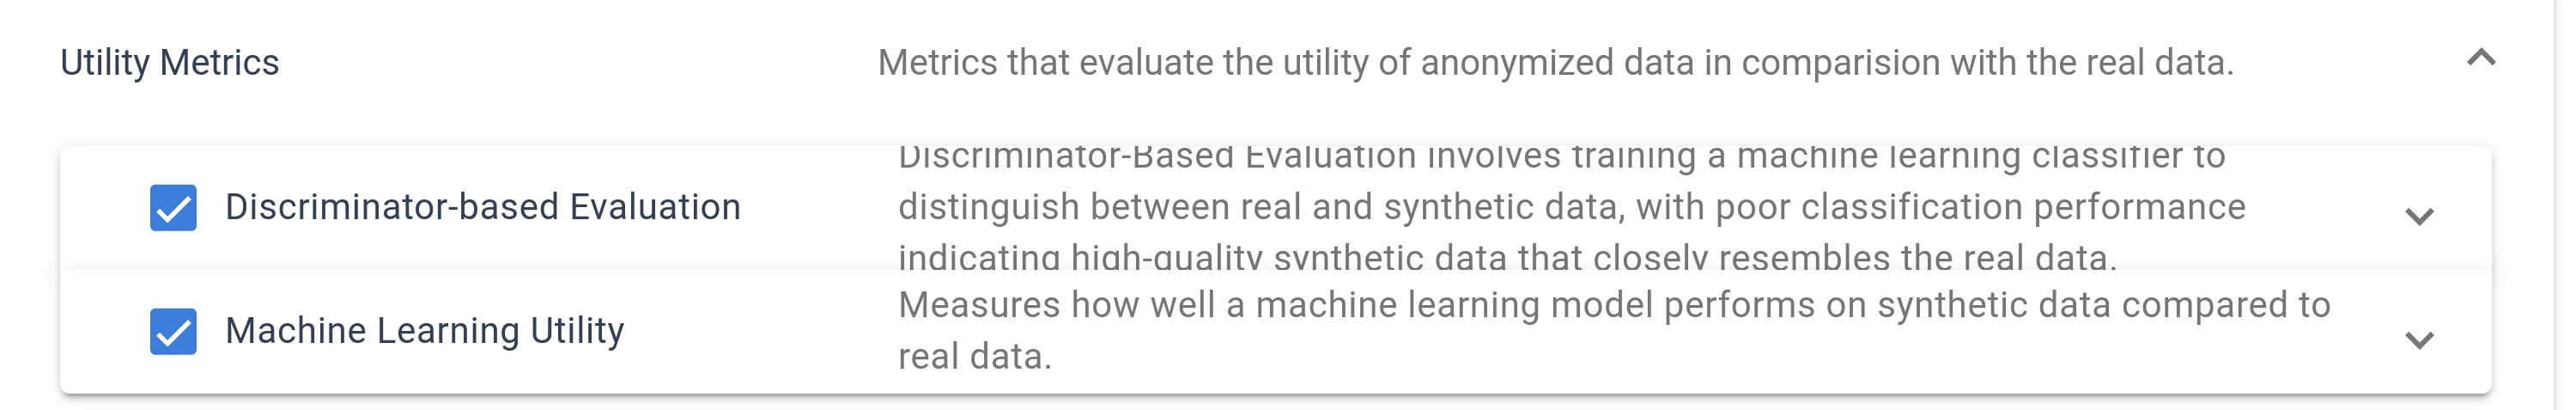
Utility Metrics:
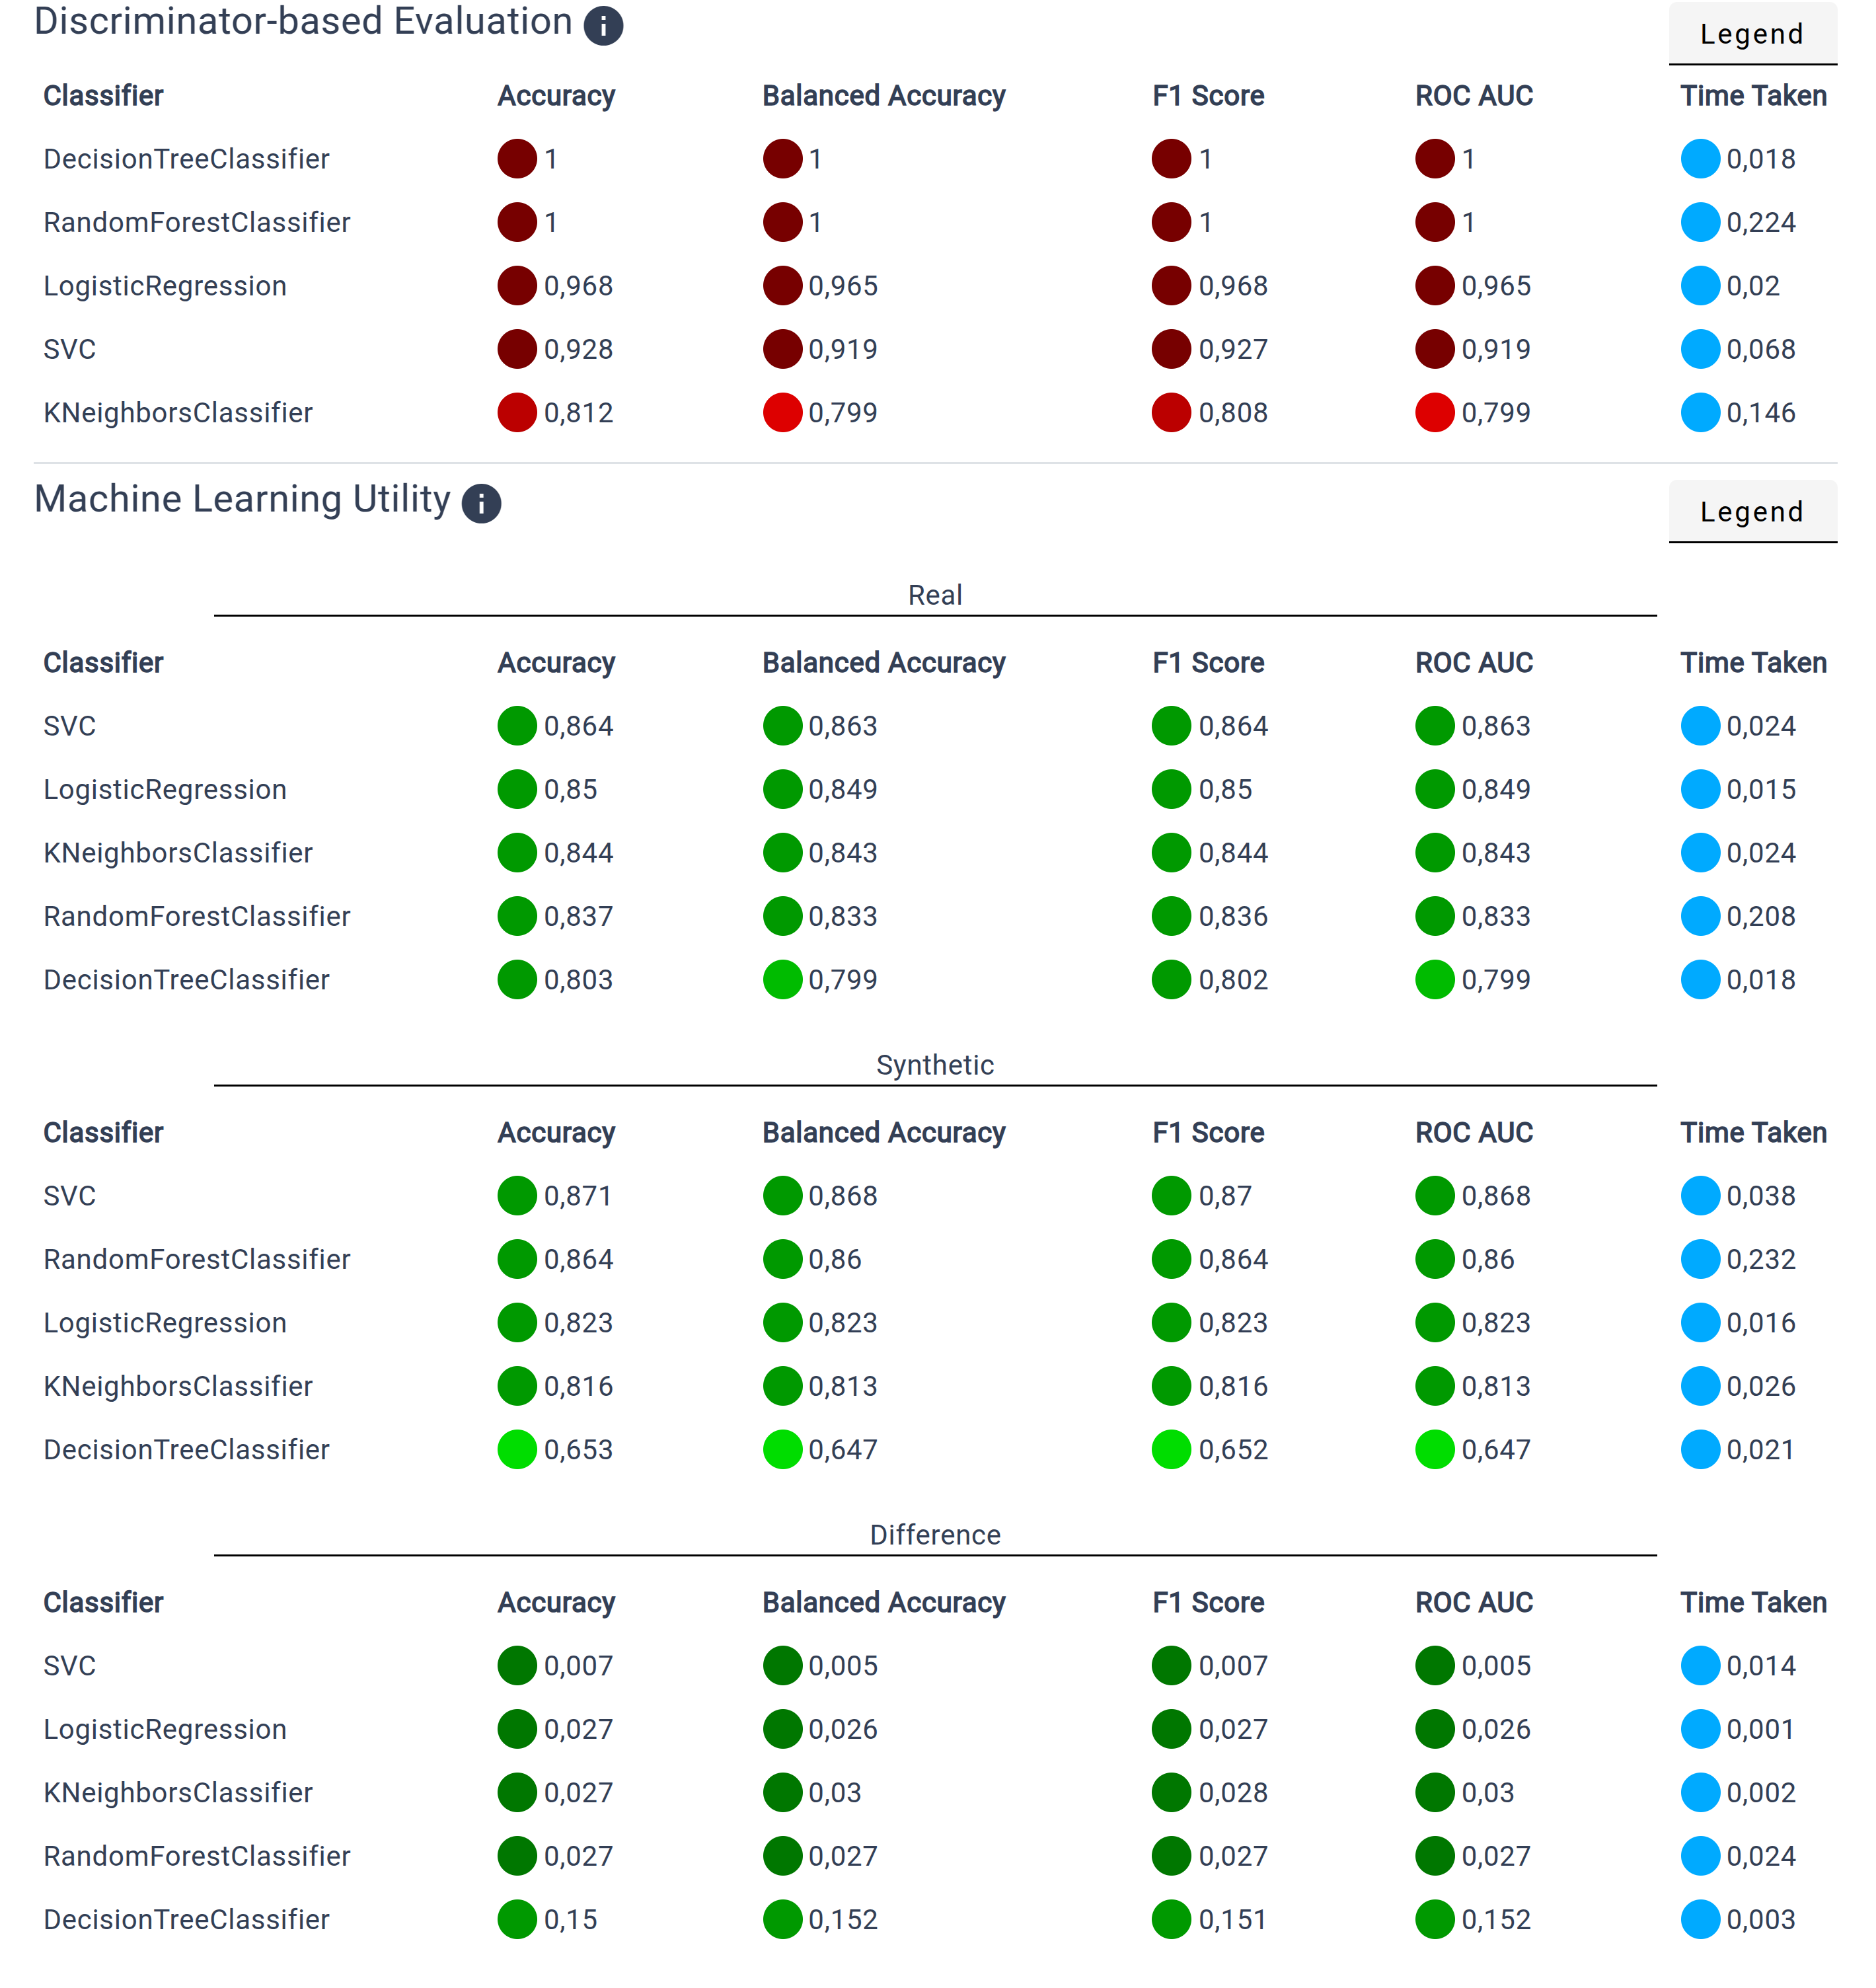
Discriminator-based Evaluation:
The Discriminator-based Evaluation trains a machine learning classifier to distinguish between the original and protected data.
A poor classification performance indicates that the protected data closely resemblance the original data.
The values range form 0 to 1, where 0.5 is the ideal result.
Machine Learning Utility: Results of the Machine Learning Utility are shown in three tables. The frist two tables display the scores for the original and protected data. Scores range from 0 to 1, where 1 indicates a good machine learning utility. The third table compares the machine learning utility of both datasets. A score of 0 means the machine learning utility performs identical.
For each classifier, the following metrics are calculated:
Accuracy: Percentage of correctly classified samples
Balanced Accuracy: Mean of sensitivity (percentage of correctly identified positives) and specificity (percentage of correctly classified negatives)
F1 Score: Different way to measure the accuracy taking into account the sensitivity (percentage of correctly identified positives) and precision (ratio of correctly identified positives and positive classified samples)
ROC AUC: Receiver Operator Characteristic Area Under the Curve measures the balance between true positives and false-positive across all classes
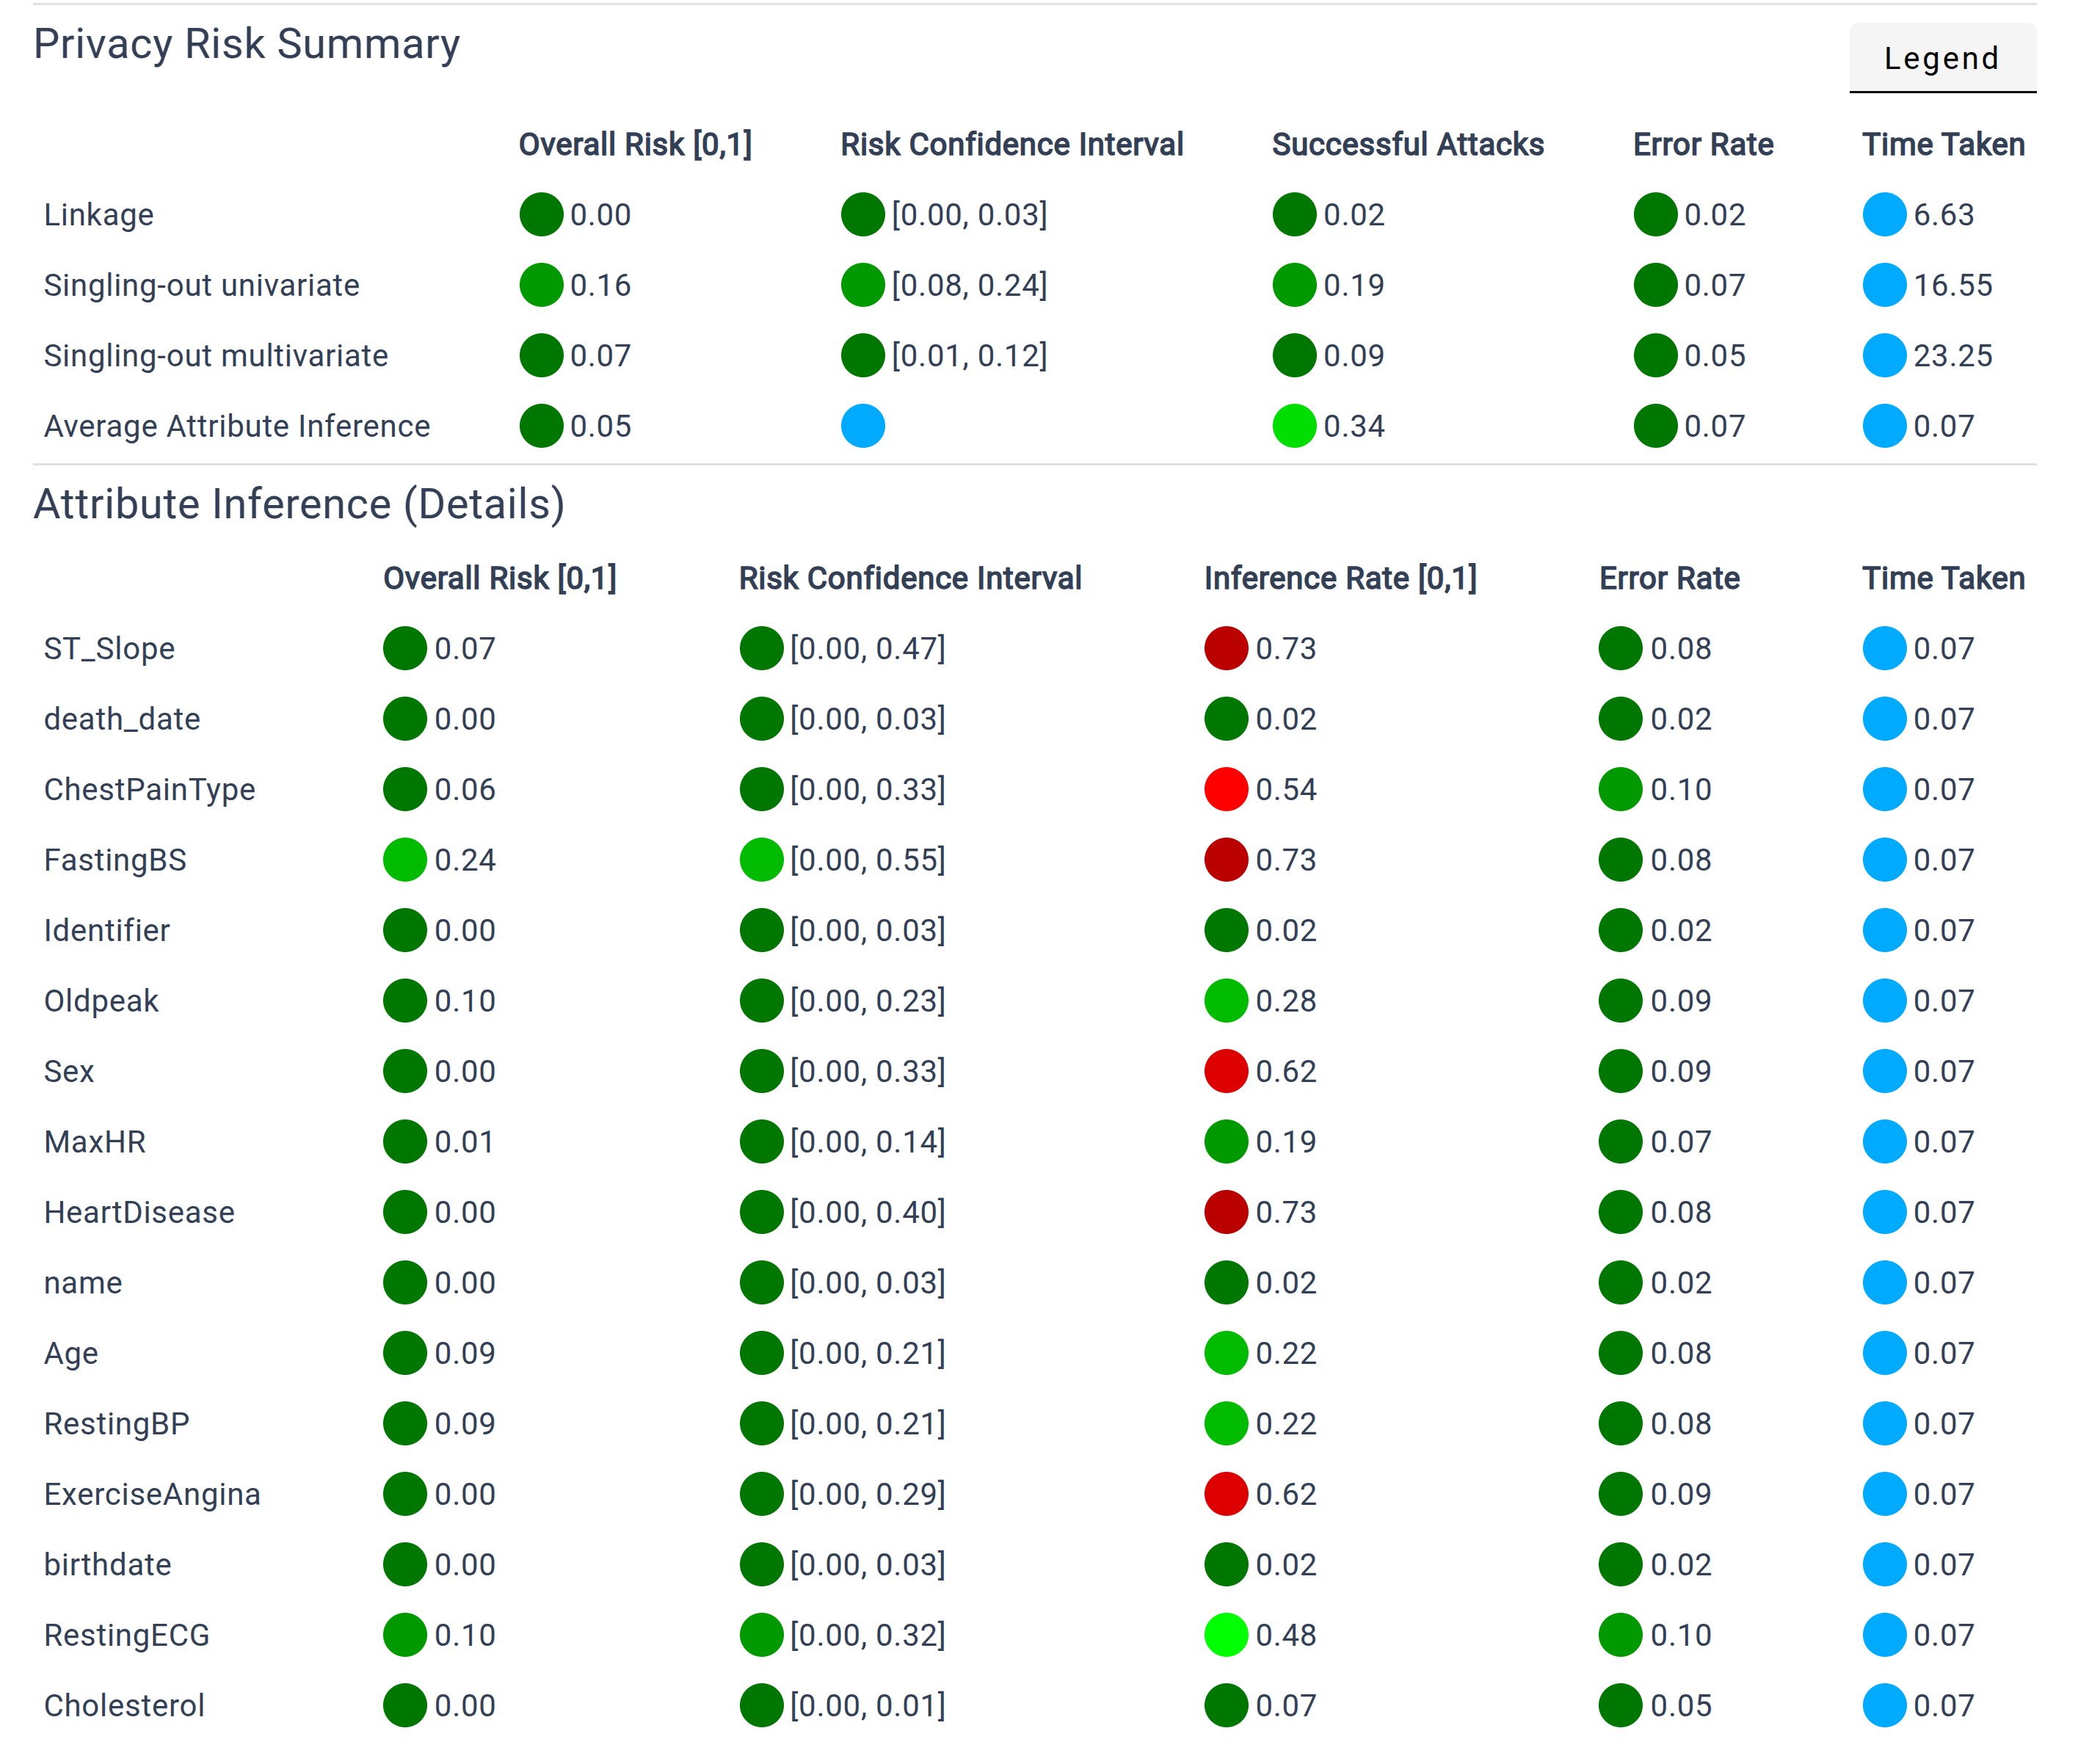
Risk Evaluation
The Risk Evaluation section presents a set of specific metrics for each attribute, helping to gauge the integrity and security of your data. The metrics include:
Overall Risk: A risk score that indicates higher risks with increasing scores, providing a clear signal of potential vulnerabilities.
Risk Confidence: The confidence interval associated with the overall risk score, offering a statistical range for understanding the precision of the risk estimate.
Successful Attack: This metric represents the ratio of attacks that were successful. Higher rates may point to systematic disparities between the protected data and the original dataset.
Error Rate: Placeholder for the Error Rate.
Inference Rate:This measures how many attribute values can be successfully inferred from other attributes, helping identify potential privacy leaks from inferable information.
These evaluations collectively offer a comprehensive overview of the strengths and weaknesses in your data protection strategy, guiding future improvements.
Color Scale
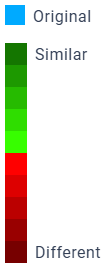
To give an impression about the evaluation, all statistical values are encoded with a color scale.
By default, blue represents the value of the original dataset, and a diverging color scale from green to red gives a rough assessment of the statistical value.
This color scale can be changed by clicking on the “Metrics” button on the left navigation bar.
A color legend of the current color scale can bee opened by clicking on the  button above graphs and and tables.
Exporting Results
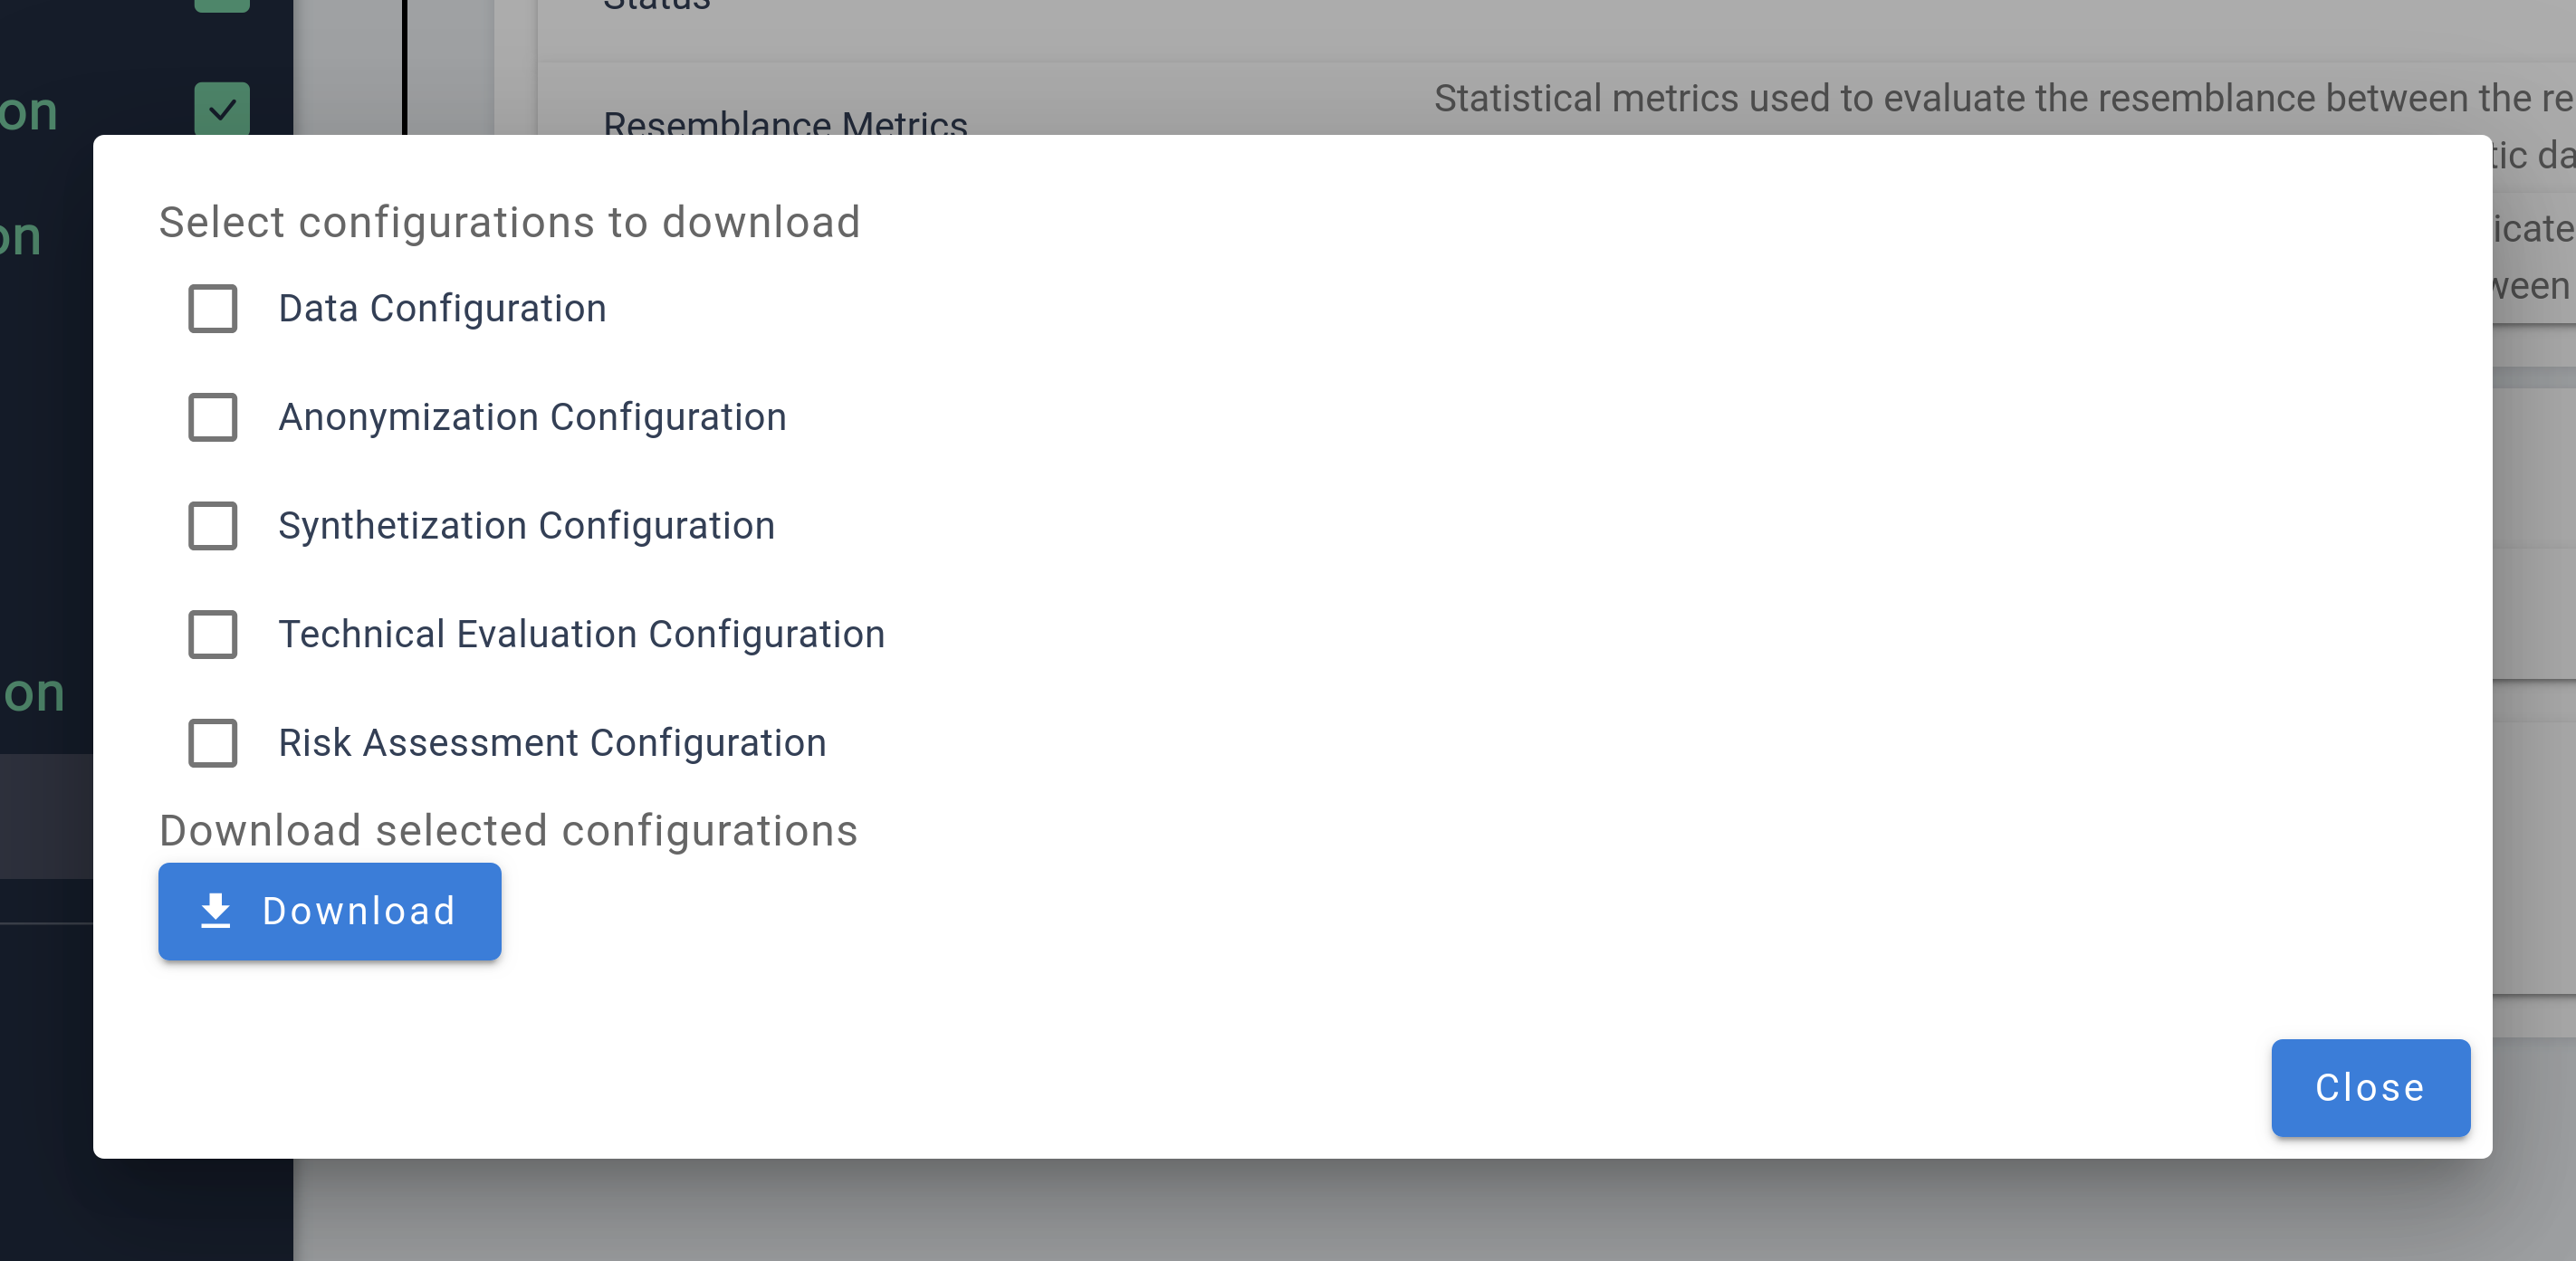
The Export Section is your go-to area for exporting your project’s data and configurations, with export buttons conveniently located in the sidebar for easy access.
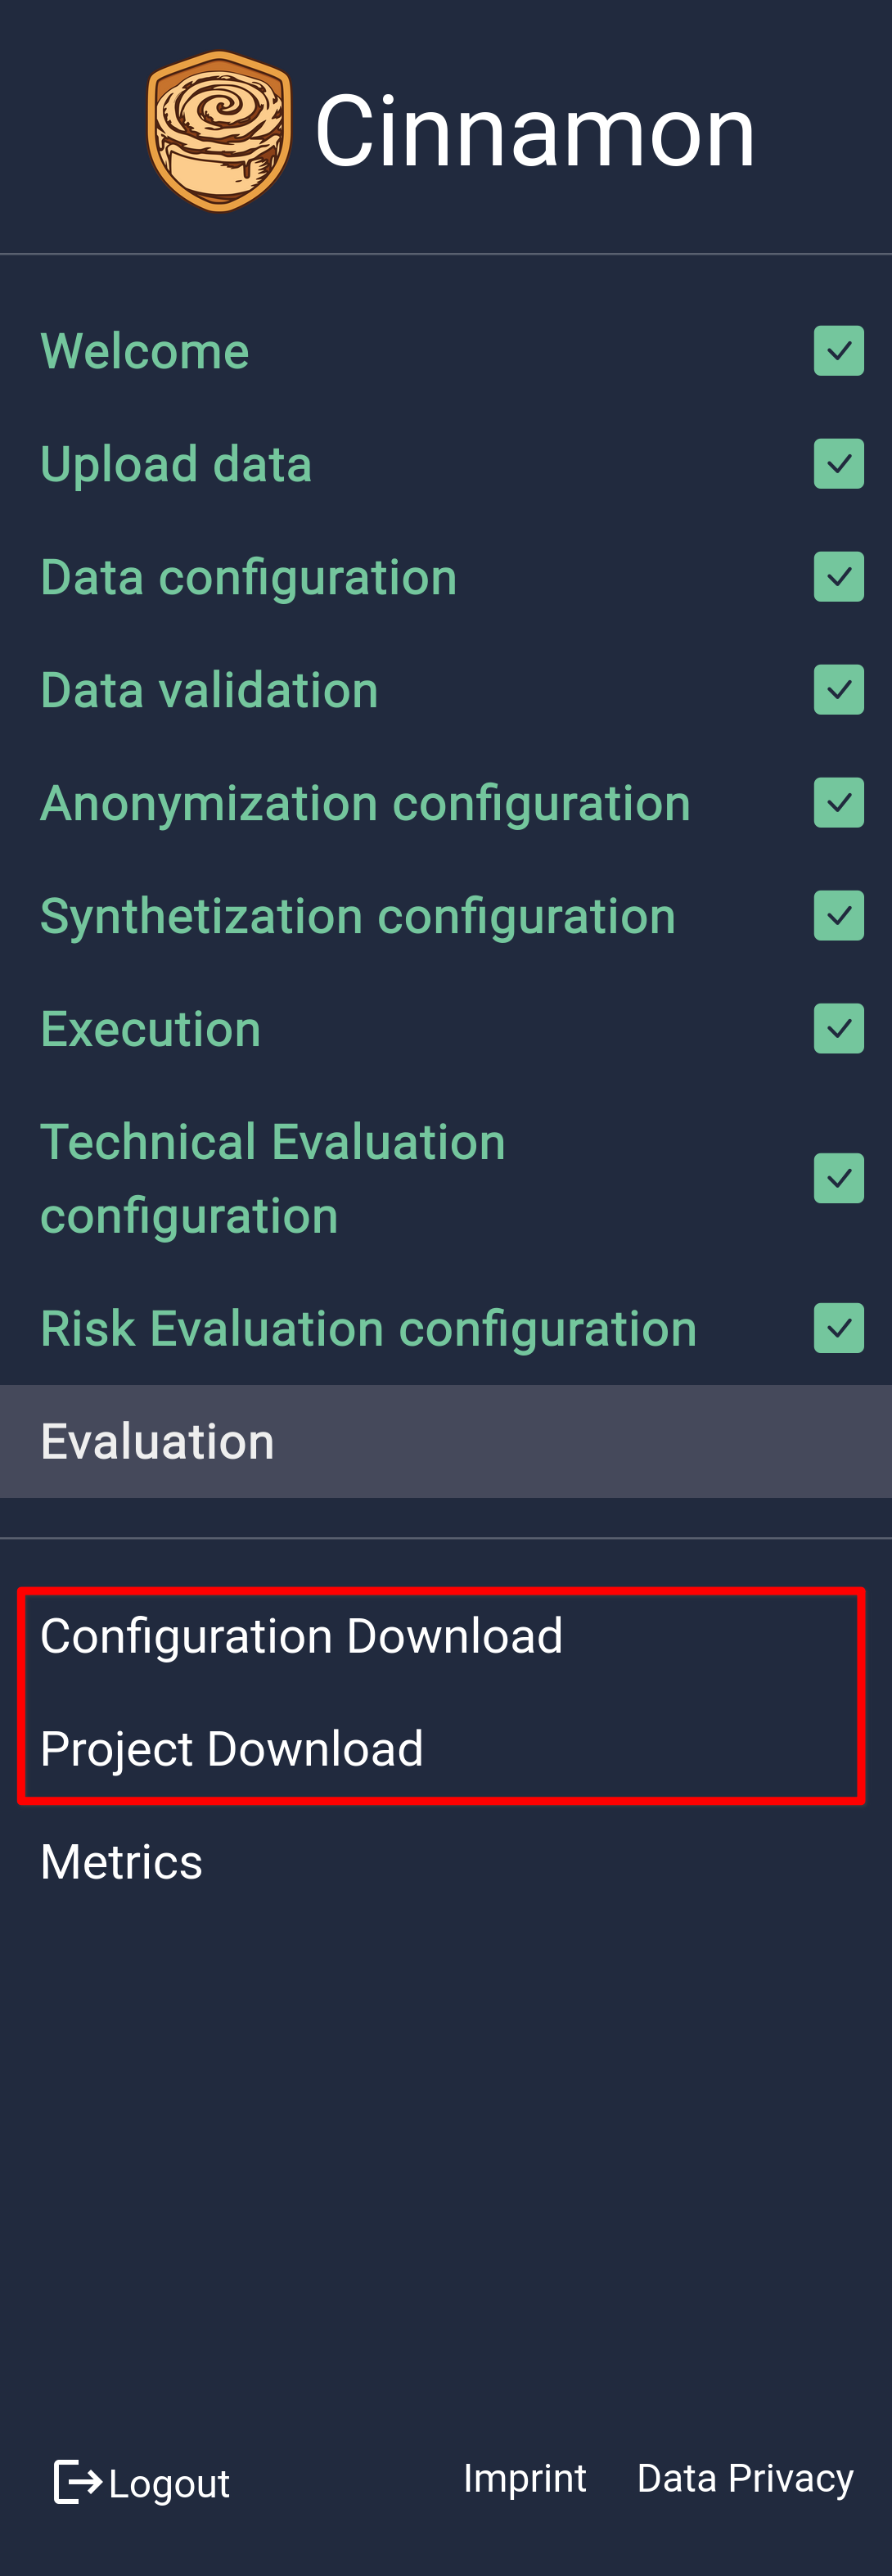
The primary export option is the Project Download, which generates a comprehensive export package encompassing all aspects of your project. This includes the original data, synthetic and anonymized data sets, train and test data used during evaluation, all configuration settings, and the results from the evaluation process. It serves as the main export function, intended for use after completing your data protection workflow, ensuring you have a complete record of your project.
In addition to this, there’s a Configuration Export option, allowing you to export specific configurations for later use. Users can select which configurations to export from a list of previously configured steps, providing flexibility and convenience in managing and reusing your setup across future projects.